目录
前言
在进行性能测试时,我们需要对测试结果进行监控和分析,以便于及时发现问题并进行优化。
Locust在内存中维护了一个时间序列数据结构,用于存储每个事件的统计信息。 这个数据结构允许我们在Charts标签页中查看不同时间点的性能指标,但是正因为Locust WebUI上展示的数据实际上是存储在内存中的。所以在Locust测试结束后,这些数据将不再可用。 如果我们需要长期保存以便后续分析测试数据,可以考虑将Locust的测试数据上报到外部的数据存储系统,如InfluxDB,并使用Grafana等可视化工具进行展示和分析。
本文将介绍如何使用Locust进行负载测试,并将测试数据上报到InfluxDB。同时,我们将使用Grafana对测试数据进行展示和分析。
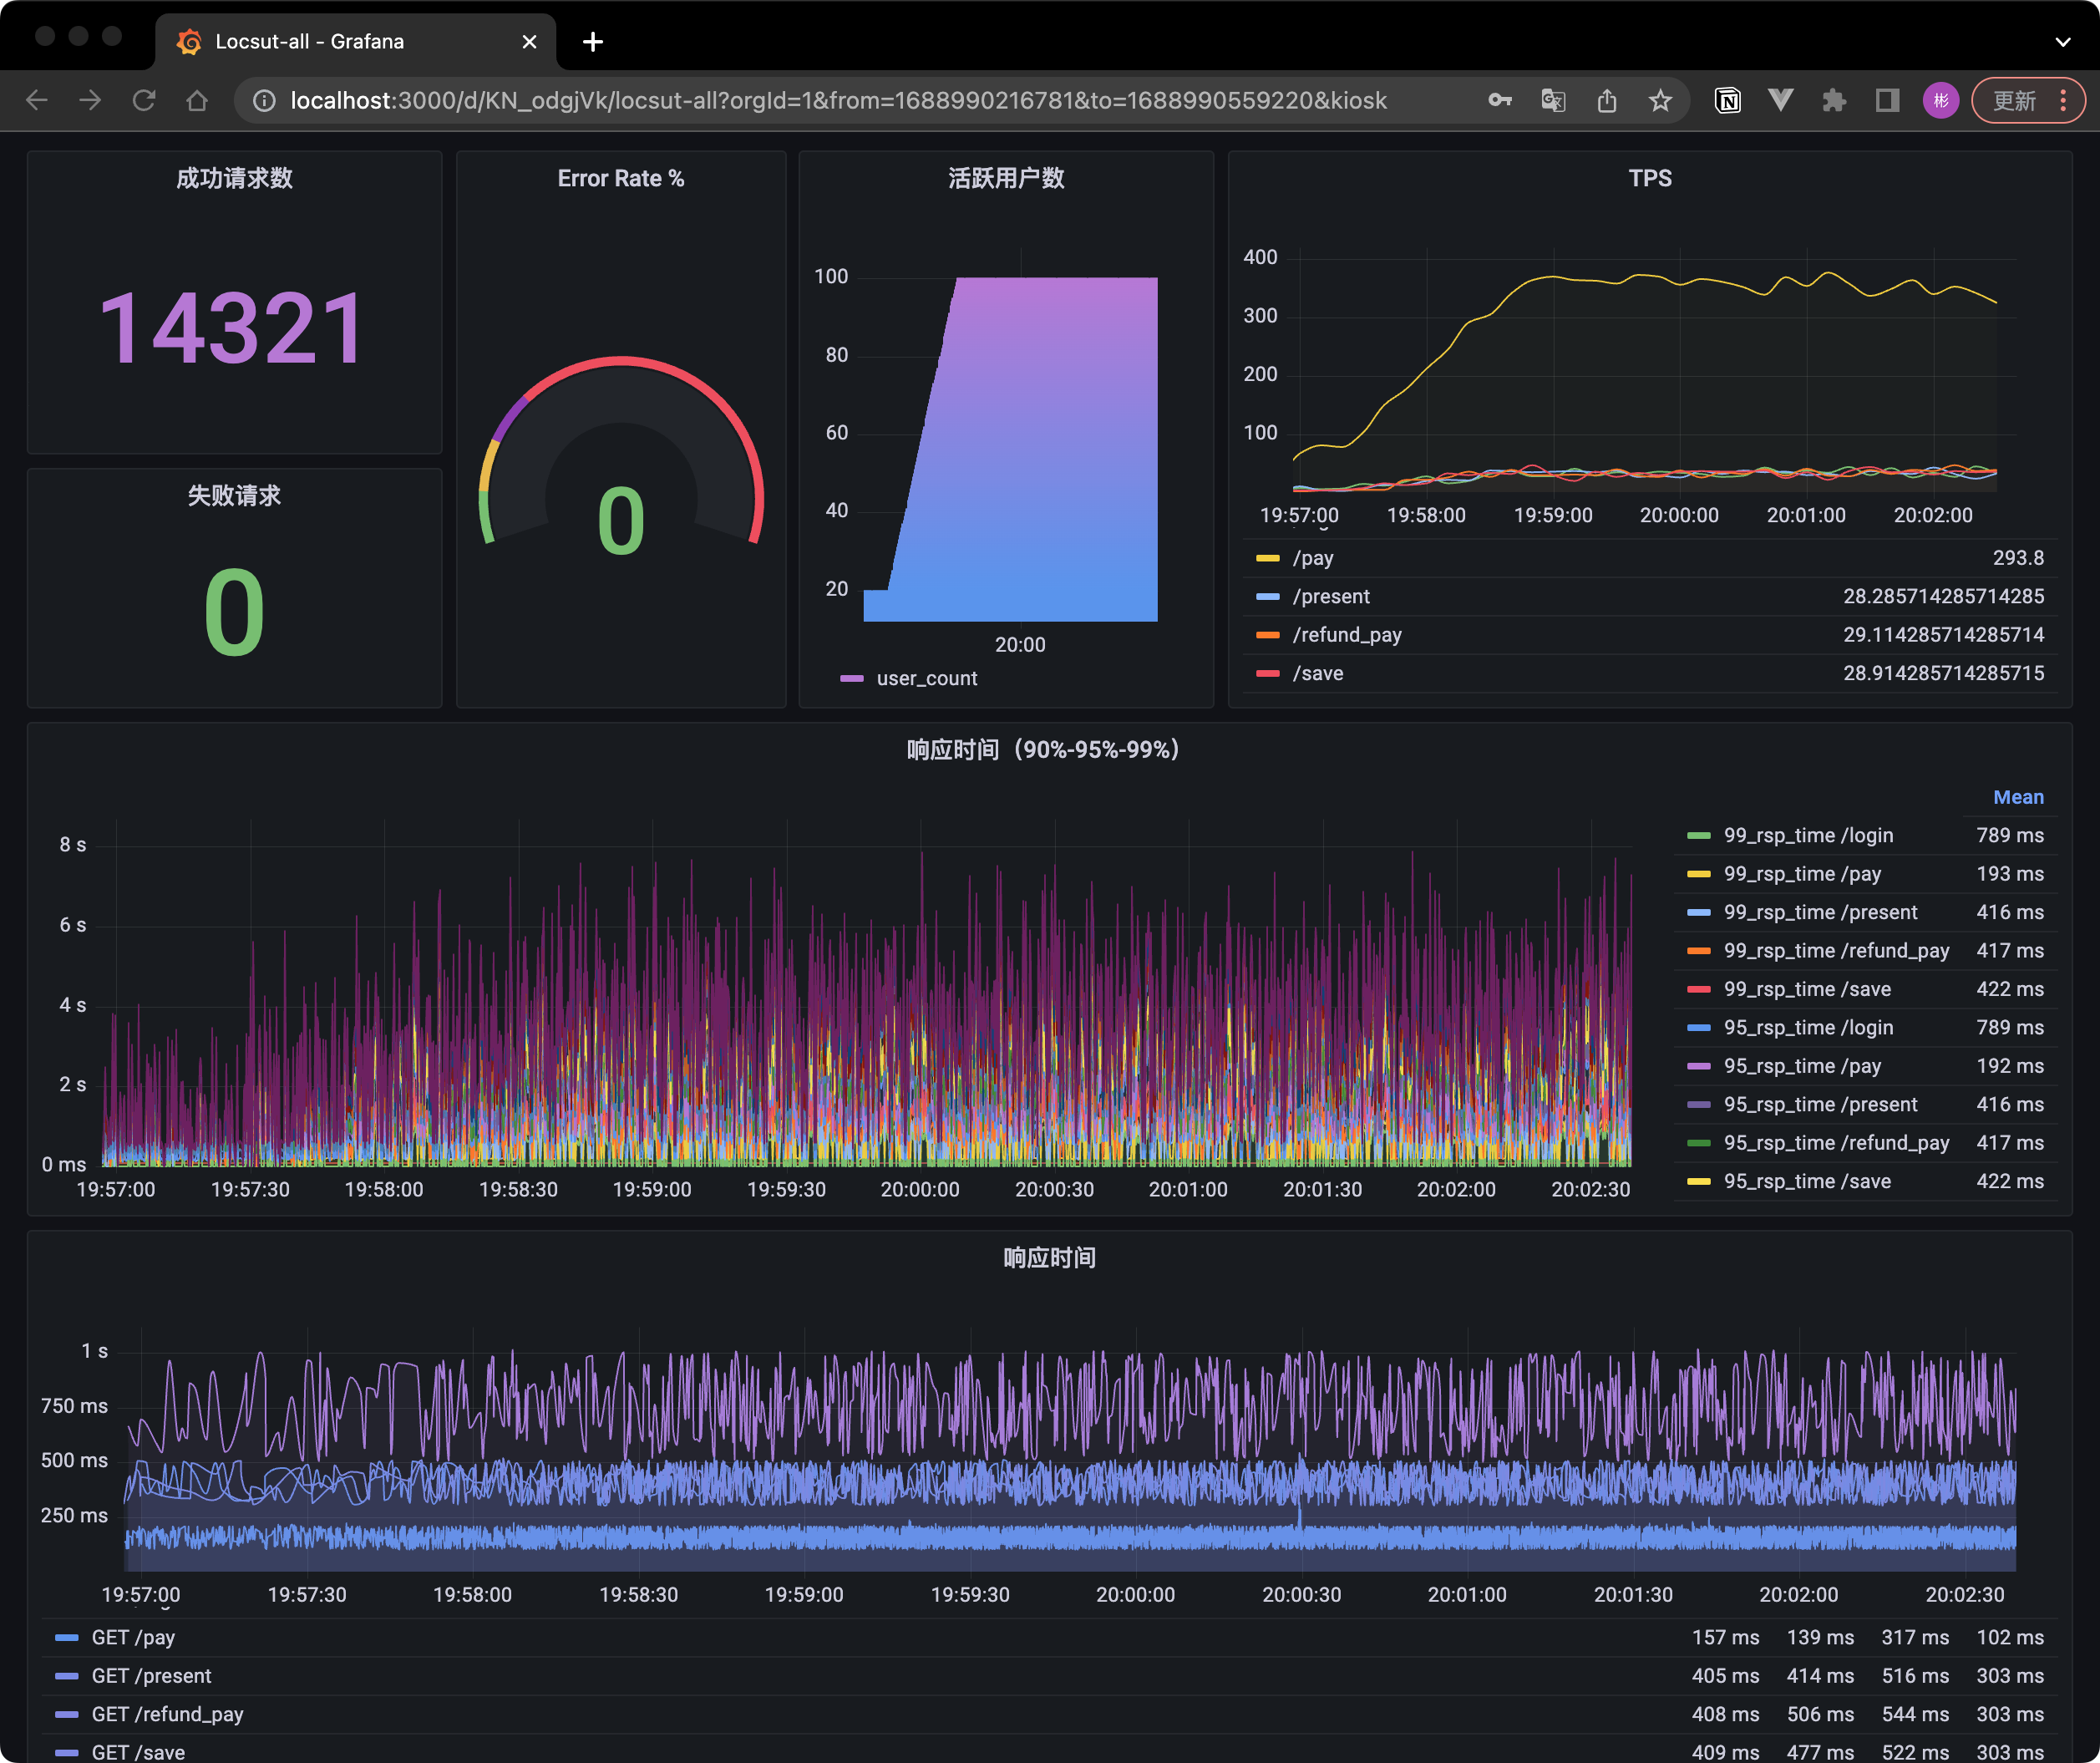
最终效果:
influxDB
InfluxDB是一款开源的时间序列数据库,专为处理大量的时间序列数据而设计。时间序列数据通常是按照时间顺序存储的数据点,每个数据点都包含一个时间戳和一个或多个与之相关的值。这种数据类型在许多场景下都非常常见,如监控系统、物联网设备、金融市场数据等。在这些场景下,数据上报是一种关键的需求,因为它可以帮助我们实时了解系统的状态和性能。
注: InfluxDB 开源的时单机版本,集群版本并未开元,但是对于普通用户的日常场景已经完全够用。
以下是关于InfluxDB的关键特性和优势的表格:
| 特性 | 优势 |
|---|---|
| 高性能 | 针对时间序列数据进行了优化,可以快速地写入和查询大量数据。 |
| 数据压缩 | 使用了高效的数据压缩算法,在磁盘上节省大量空间。 |
| 自带查询语言 | 具有一种名为InfluxQL的查询语言,类似于SQL,便于查询和分析数据。 |
| 数据保留策略 | 支持设置数据保留策略,可以自动清除过期的数据。 |
| 易于集成 | 具有丰富的API和客户端库,可以轻松地与其他系统和工具集成。 |
安装运行InfluxDB
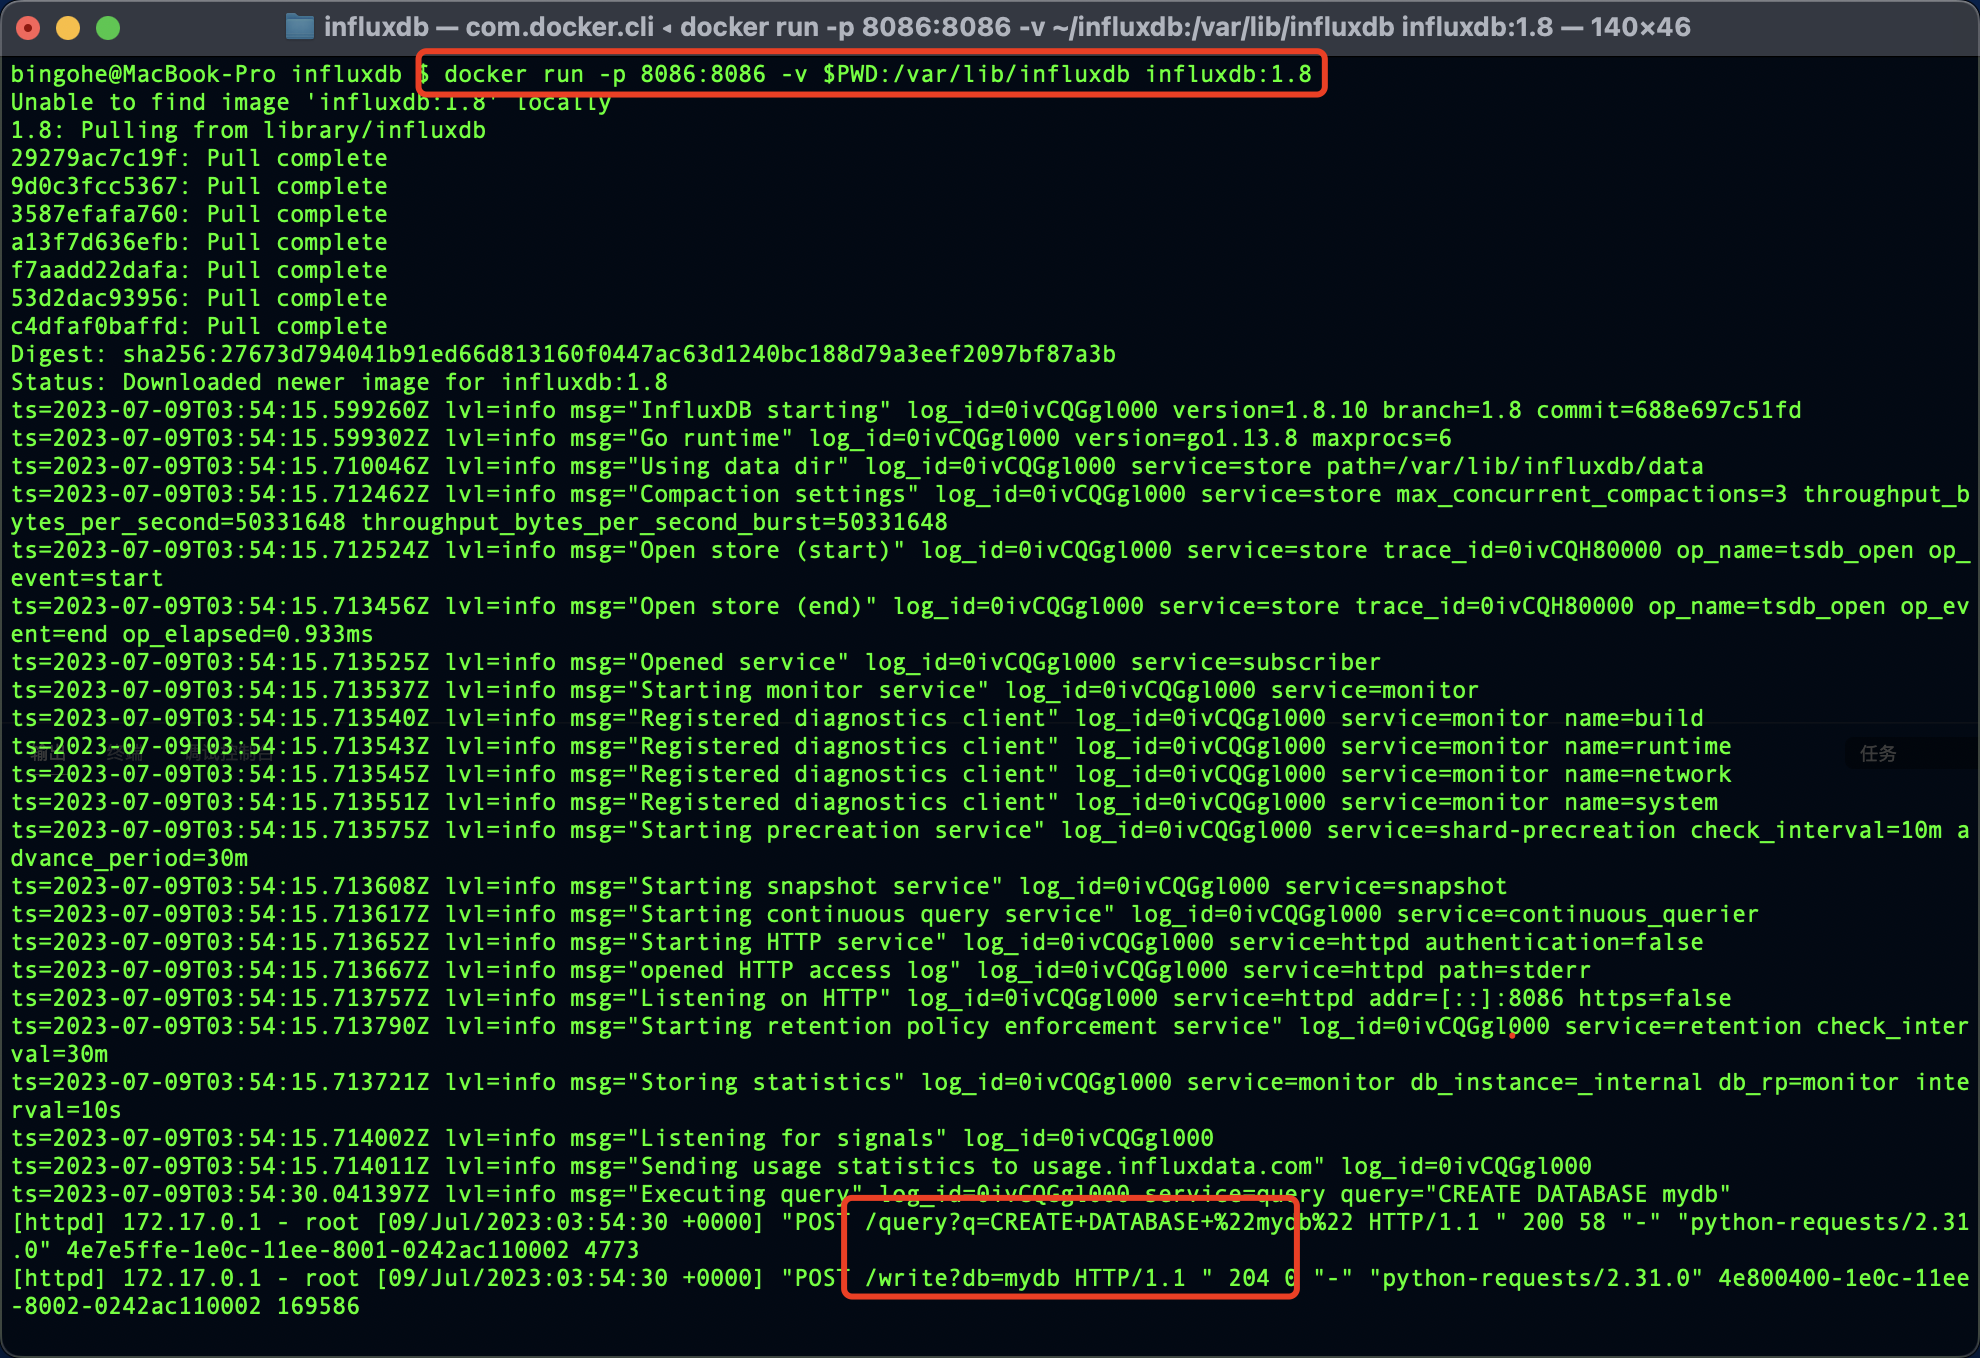
如果你已经安装了Docker,可以直接使用官方的InfluxDB镜像来运行InfluxDB:
docker run -p 8086:8086 -v $PWD:/var/lib/influxdb influxdb:1.8
此命令将在Docker容器中启动InfluxDB,并将主机上的8086端口映射到容器的8086端口。
点击查看在如何在不同操作系统中如何安装 InfluxDB
用Python 上报数据到influxdb
首先,确保已经安装了influxdb库:
pip install influxdb
然后,使用以下代码上报数据到InfluxDB:
以下是一个使用Python操作InfluxDB上报数据的示例,对照MySQL进行注释:
import time
from influxdb import InfluxDBClient

# 连接到InfluxDB(类似于连接到MySQL数据库)
client = InfluxDBClient(host='localhost', port=8086)

# 创建数据库(类似于在MySQL中创建一个新的数据库)
client.create_database('mydb')

# 切换到创建的数据库(类似于在MySQL中选择一个数据库)
client.switch_database('mydb')

# 上报数据(类似于在MySQL中插入一条记录)
data = [
    {
        # 在InfluxDB中,measurement相当于MySQL中的表名
        "measurement": "cpu_load",
        # tags相当于MySQL中的索引列,用于快速查询
        "tags": {
            "host": "server01",
            "region": "us-west"
        },
        # time为时间戳,是InfluxDB中的关键字段
        "time": int(time.time_ns()),
        # fields相当于MySQL中的数据列,用于存储实际的数据值
        "fields": {
            "value": 0.64
        }
    }
]

# 写入数据(类似于在MySQL中执行INSERT语句)
client.write_points(data)
在这个示例中,我们首先连接到InfluxDB(类似于连接到MySQL数据库),然后创建一个名为mydb的数据库(类似于在MySQL中创建一个新的数据库),并切换到创建的数据库(类似于在MySQL中选择一个数据库)。接着,我们准备了一条名为cpu_load的数据(在InfluxDB中,measurement相当于MySQL中的表名),并为数据添加了host和region标签(类似于MySQL中的索引列)。最后,我们将数据写入到InfluxDB中(类似于在MySQL中执行INSERT语句)。
执行上面的代码后我们可以看到我们的操作成功了:
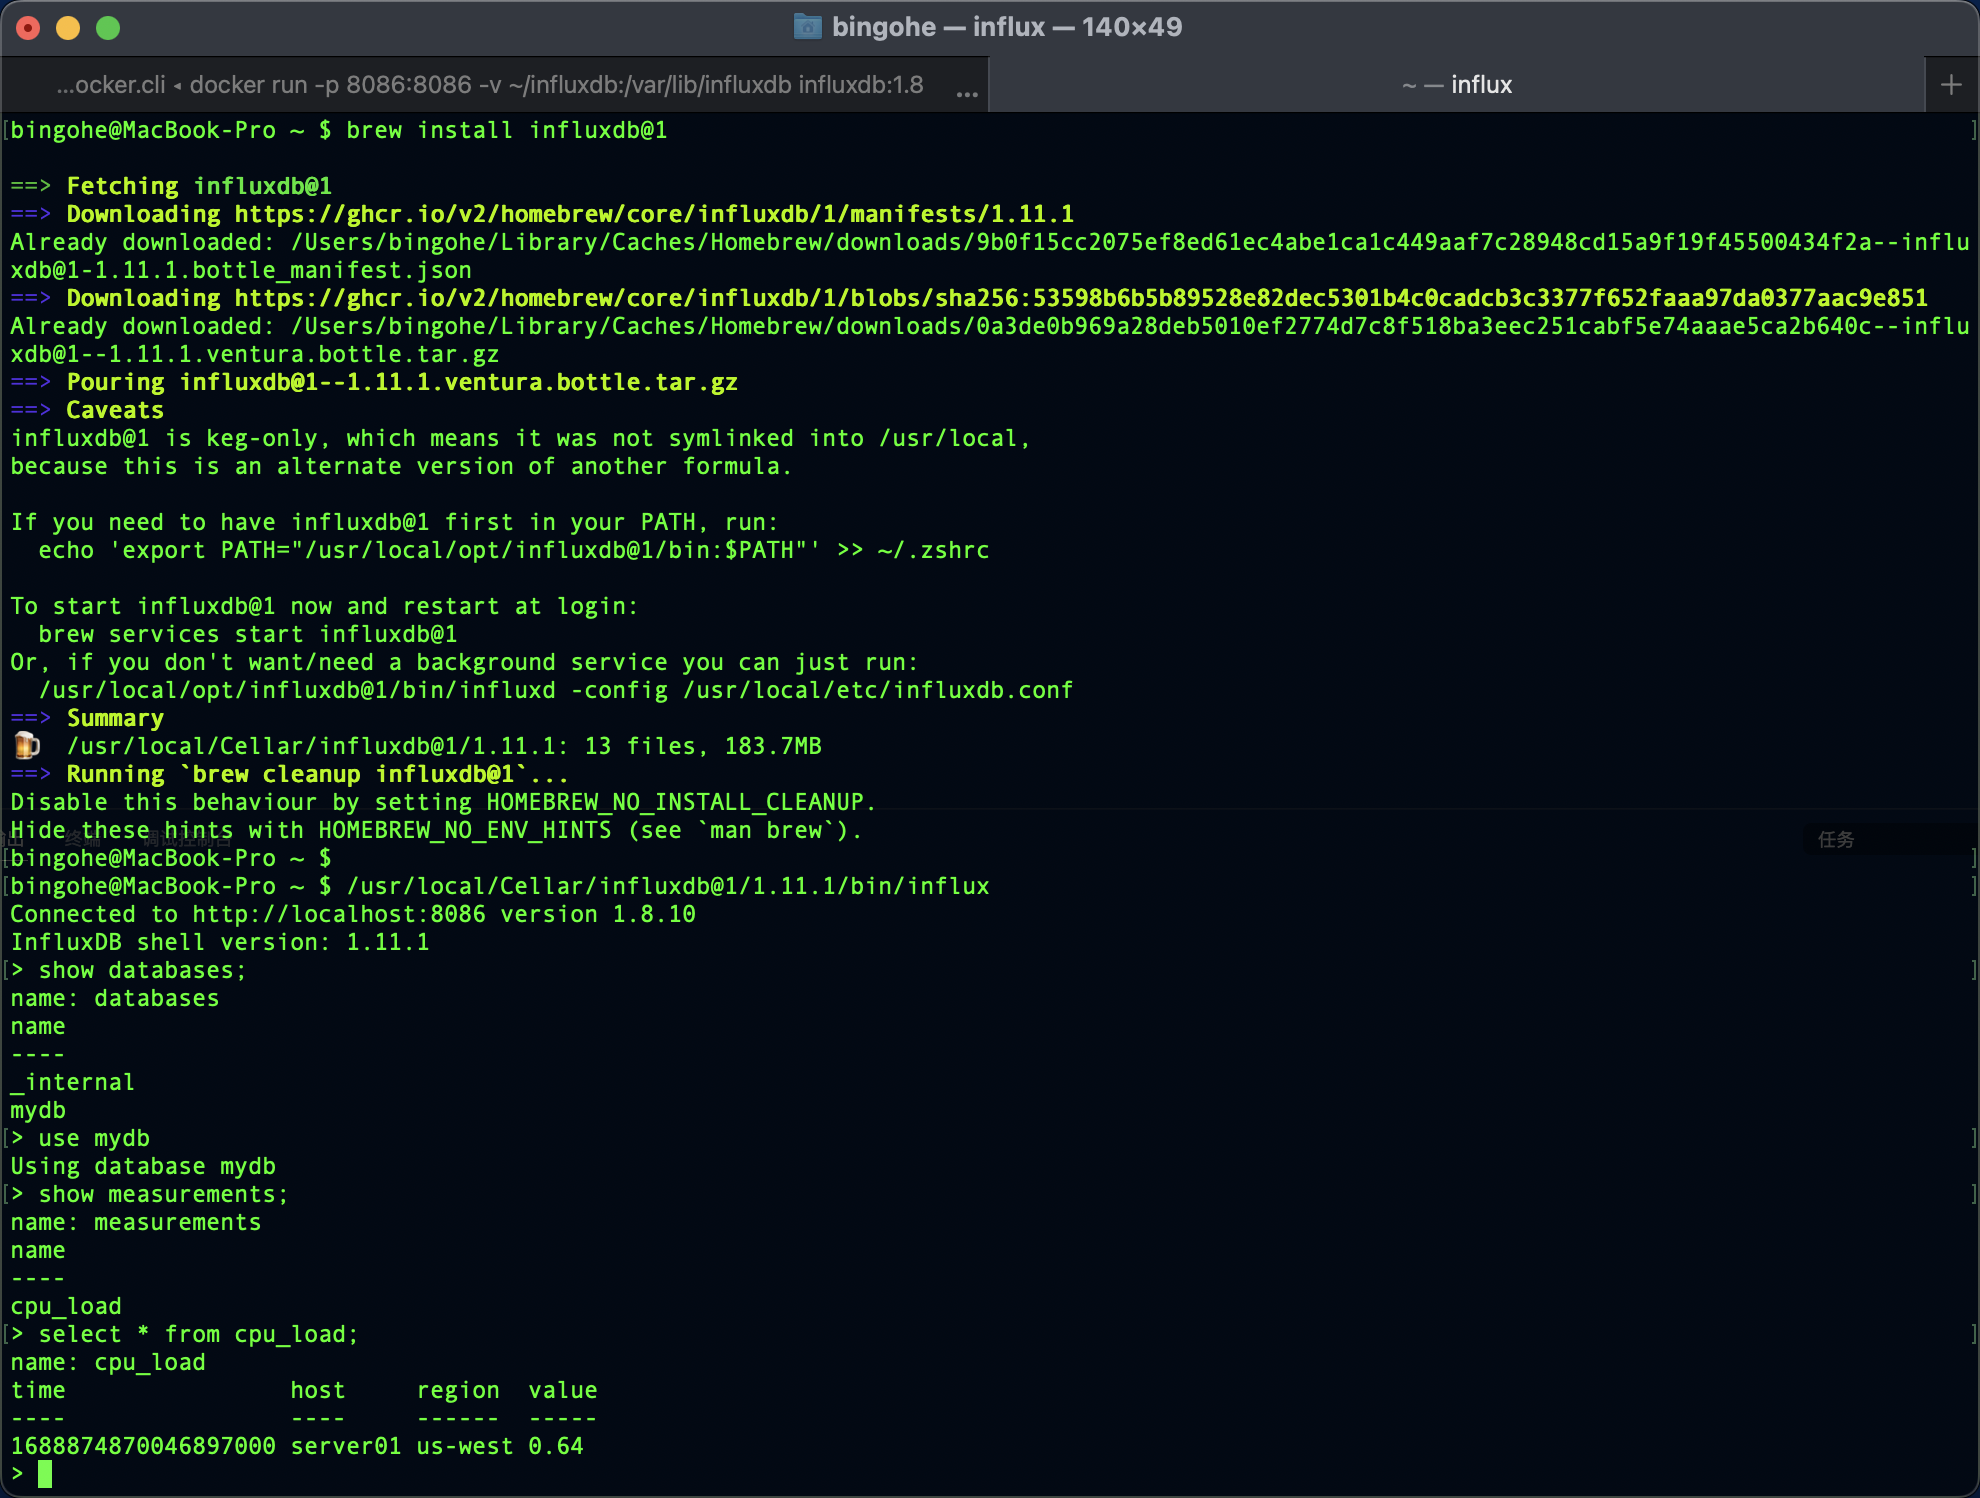
如果我们安装了influx-cli就可以在命令行中直接查询刚才写入的数据:
bingohe@MacBook-Pro ~ $ /usr/local/Cellar/influxdb@1/1.11.1/bin/influx
Connected to http://localhost:8086 version 1.8.10
InfluxDB shell version: 1.11.1
> show databases;
name: databases
name
----
_internal
mydb
> use mydb
Using database mydb
> show measurements;
name: measurements
name
----
cpu_load
> select * from cpu_load;
name: cpu_load
time                host     region  value
----                ----     ------  -----
1688874870046897000 server01 us-west 0.64
点击查看如何使用命令行访问InfluxDB
ocust 数据写入到 influx
在 【Python】万字长文,Locust 性能测试指北(上) 中我们提到过Locust的生命周期,我们也通过Locust生命周期实现了集合点的功能。现在我们一起来通过它实现测试数据的实时展示。
Locust的生命周期
点击查看Locust的生命周期
上报数据
我们先来看看常用的事件里面可以获取到的数据:
import time
from locust import HttpUser, task, between, events


@events.request.add_listener
def request_handler(*args, **kwargs):
    print(f"request args: {args}")
    print(f"request kwargs: {kwargs}")


@events.worker_report.add_listener
def worker_report_handlers(*args, **kwargs):
    print(f"worker_report args: {args}")
    print(f"worker_report kwargs: {kwargs}")


@events.test_start.add_listener
def test_start_handlers(*args, **kwargs):
    print(f"test_start args: {args}")
    print(f"test_start kwargs: {kwargs}")


@events.test_stop.add_listener
def test_stop_handlers(*args, **kwargs):
    print(f"test_stop args: {args}")
    print(f"test_stop kwargs: {kwargs}")


class QuickstartUser(HttpUser):
    wait_time = between(1, 2)

    @task
    def root(self):
        with self.client.get("/", json={"time": time.time()}, catch_response=True) as rsp:
            rsp_json = rsp.json()
            if rsp_json["id"] != 5:
                # 失败时上报返回的数据
                rsp.failure(f"{rsp_json}")
运行一次测试时能看到这些生命周期内的Locust 对外暴露的数据:
test_start args: ()
test_start kwargs: {'environment': <locust.env.Environment object at 0x10c426c70>}
request args: ()
request kwargs: {'request_type': 'GET', 'response_time': 2.6886250000011103, 'name': '/', 'context': {}, 'response': <Response [200]>, 'exception': None, 'start_time': 1688888321.896039, 'url': 'http://0.0.0.0:10000/', 'response_length': 8}
request args: ()
request kwargs: {'request_type': 'GET', 'response_time': 2.735957999998817, 'name': '/', 'context': {}, 'response': <Response [200]>, 'exception': CatchResponseError("{'id': 6}"), 'start_time': 1688888323.421389, 'url': 'http://0.0.0.0:10000/', 'response_length': 8}
test_stopping args: ()
test_stopping kwargs: {'environment': <locust.env.Environment object at 0x10c426c70>}
test_stop args: ()
test_stop kwargs: {'environment': <locust.env.Environment object at 0x10c426c70>}
从上面的监控我们可以看到,每次任务启动和停止的时候会分别调用@events.test_start.add_listener和@events.test_stop.add_listener装饰的函数,每次请求发生的的时候都会调用@events.request.add_listener 监听器装饰的函数,我们就是要利用这一点来进行数据的上报。
通过查看 Locust 的 EventHook 源码注释我们可以看到标准的使用方法:
#.../site-packages/locust/event.py
...
class EventHook:
    """
    Simple event class used to provide hooks for different types of events in Locust.

    Here's how to use the EventHook class::

        my_event = EventHook()
        def on_my_event(a, b, **kw):
            print("Event was fired with arguments: %s, %s" % (a, b))
        my_event.add_listener(on_my_event)
        my_event.fire(a="foo", b="bar")

    If reverse is True, then the handlers will run in the reverse order
    that they were inserted
    """
...
结合前面的写数据到 influxDB的实现,上报数据这一项一下子就变简单了:
简单实现每次请求数据上报 到 influxDB
下面的代码运行Locust测试后会自动创建一个locust_requests的 measurement,然后将每次请求的数据上报。
运行方法可以参考我的上一篇文章
import time
from datetime import datetime
from influxdb import InfluxDBClient

from locust import HttpUser, task, between, events

client = InfluxDBClient(host='localhost', port=8086, database="mydb")

def request(request_type, name, response_time, response_length, response, context, exception, url, start_time):
    _time = datetime.utcnow()
    was_successful = True
    if response:
        was_successful = 199 < response.status_code < 400
    tags = {
        'request_type': request_type,
        'name': name,
        'success': was_successful,
        'exception': str(exception),
    }
    fields = {
        'response_time': response_time,
        'response_length': response_length,
    }
    data = {"measurement": 'locust_requests', "tags": tags, "time": _time, "fields": fields}
    client.write_points([data])

# 在每次请求的时候通过前面定义的request函数写数据到 DB
events.request.add_listener(request)


class QuickstartUser(HttpUser):
    wait_time = between(1, 2)

    @task
    def root(self):
        with self.client.get("/", json={"time": time.time()}, catch_response=True) as rsp:
            rsp_json = rsp.json()
            if rsp_json["id"] != 5:
                rsp.failure(f"{rsp_json}")
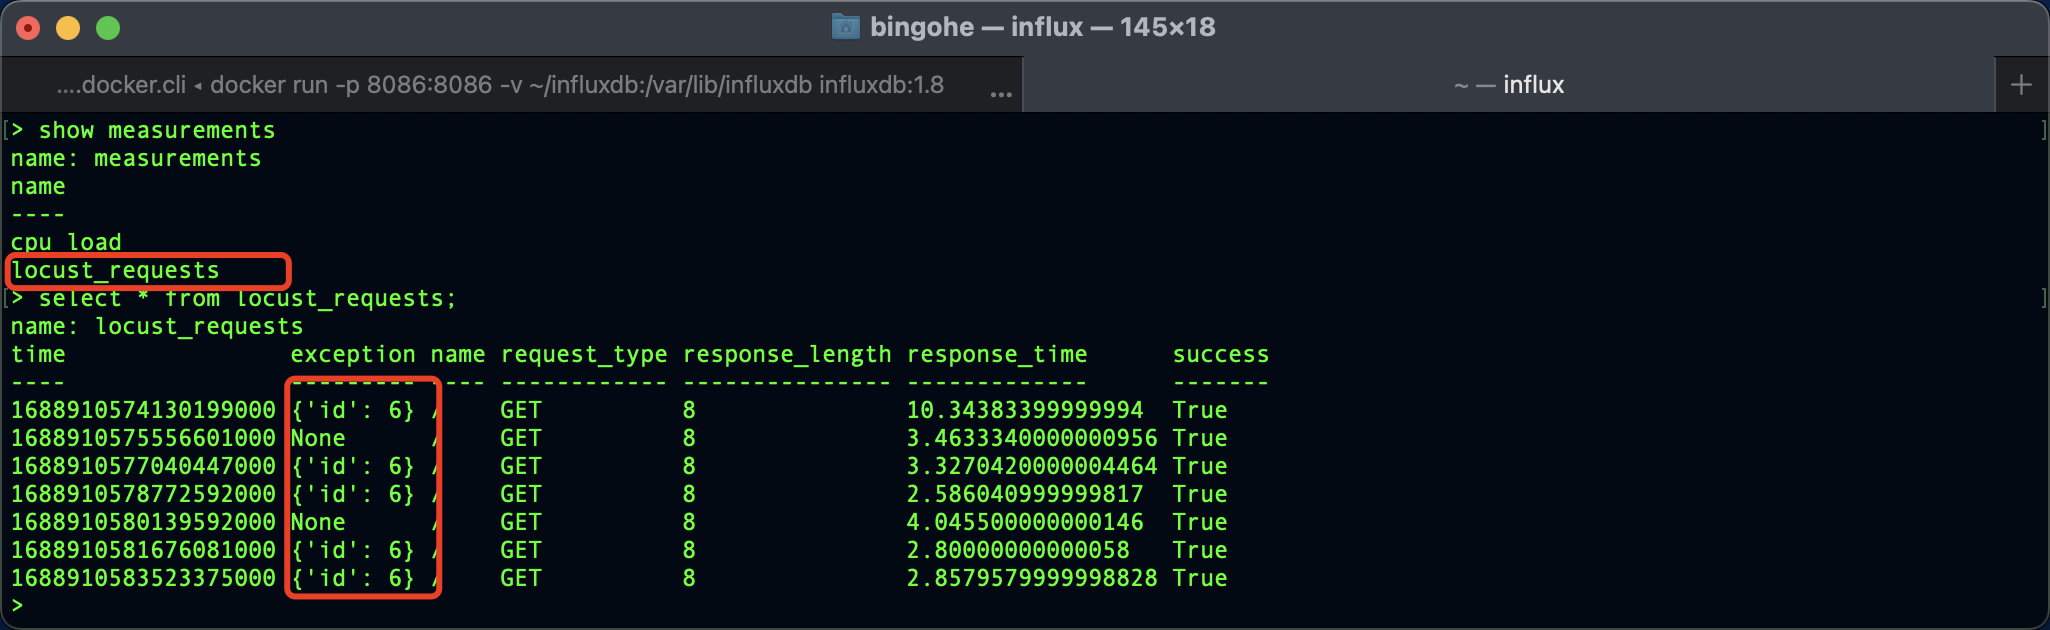
上报的数据 influxDB 中查询到:
优化升级
上面的这个上报很粗糙,每次请求会上报一次数据,会影响实际的压测,如果我们将要上报的数据放在一个数据结构中中,异步的上报这个数据将极大的提升性能
# 将 __flush_points 方法中的写入操作放到一个单独的线程中,避免阻塞主线程,提高性能。
self.write_thread = threading.Thread(target=self.__write_points_worker)

# 批量写入
if len(self.write_batch) >= self.batch_size or time.time() - self.last_flush_time >= self.interval_ms / 1000:

# 使用 gzip 压缩上报的数据
influxdb_writer = InfluxDBWriter('localhost', 8086, 'mydb', batch_size=1000, gzip_enabled=True)
...
配置Grafana
在测试数据被上报到InfluxDB之后,可以通过Grafana进行数据展示和分析。需要先在Grafana中配置InfluxDB数据源,然后创建相应的图表和仪表盘。
在创建图表和仪表盘时,可以选择InfluxDB作为数据源,并使用InfluxQL查询语言进行数据查询和过滤。可以根据需要选择不同的图表类型和显示方式,以展示测试结果数据的趋势和变化。
总结
本文介绍了如何将Locust测试数据上报到InfluxDB,并通过Grafana进行展示和分析。通过将测试数据与监控工具相结合,可以更好地了解系统的性能和稳定性,及时发现问题并进行优化,也可以方便后续进行测试数据分析。希望本文能对大家有所帮助。
资料获取方法
【留言777】

各位想获取源码等教程资料的朋友请点赞 + 评论 + 收藏,三连!
三连之后我会在评论区挨个私信发给你们~