表弟找我说想开个加盟店, 不知道什么品牌好,让我帮他参谋参谋。
还好我会Python,分分钟就获取到了全国加盟品牌信息,稍加分析就筛选出了最适合他的品牌。
话不多说,咱们直接分享干货!
准备工作
开发环境
- python 3.8
- pycharm
- jupyter
模块使用
- requests
- parsel
- csv
- pandas
- pyecharts
第三方模块需要手动安装,win + R 输入cmd 输入安装命令 pip install 模块名 (如果你觉得安装速度比较慢, 你可以切换国内镜像源)
获取数据部分
流程步骤
明确需求
明确采集网址以及数据内容
网址: http://www.*****.com/brandList (winshangdata 替换 删掉括号)
数据: 每一个品牌基本信息
1、抓包分析, 数据是请求那个链接可以得到
- 开发者工具进行抓包 --> F12 / FN+F12 / 鼠标右键点击检测选择network
- 刷新网页
- 搜索数据
2、如何才能获取多个数据
对于单个数据包链接地址, 进行比较, 查看规律
brandId --> 品牌ID变化
能不能在某一个数据包当中, 找到所有品牌ID --> 列表页面抓包
代码实现步骤
1、发送请求, 对于品牌ID的数据包发送请求
2、获取数据, 获取服务器返回响应数据
3、解析数据, 提取我们需要的内容 ==> 品牌ID
4、发送请求, 请求数据详情页
5、获取数据, 获取服务器返回响应数据
6、解析数据, 提取我们需要的内容 ==> 品牌基本信息
7、保存数据, 把数据保存到表格文件
代码展示
模块
# 导入数据请求模块 需要安装
import requests
# 导入数据解析模块
import parsel
# 导入csv模块
import csv
1、发送请求
# 模拟浏览器 <请求头伪装>
headers = {


    # User-Agent 用户代理 表示浏览器基本身份信息
    'User-Agent': 'Mozilla/5.0 (Windows NT 10.0; Win64; x64) AppleWebKit/537.36 (KHTML, like Gecko) Chrome/114.0.0.0 Safari/537.36'
}
for page in range(1, 11):
    print(f'---正在采集第{

      page}的数据内容---')
    # 请求链接
    url = 'http://www.****.com/wsapi/brand/list3_4'
    # 提交表单
    data = {


        "isHaveLink": "",
        "isTuozhan": "",
        "isXxPp": "",
        "kdfs": "",
        "key": "",
        "orderBy": "1",
        "pageNum": page,
        "pageSize": 60,
        "pid": "",
        "qy_p": "",
        "qy_r": "",
        "xqMj": "",
        "ytlb1": "",
        "ytlb2": ""
    }
    # 发送请求
    response = requests.post(url, json=data, headers=headers)
2、获取数据
json_data = response.json()
print(ison_data)
3、解析数据
json_data = response.json()
for index in json_data['data']['list']:
    link = f'http://www.***.com/brandDetail?brandId={

      index["brandId"]}'
4-5、发送请求 获取数据
print(html_data)
html_data = requests.get(link, headers=headers).text
break
6、解析数据
html_data = requests.get(link, headers=headers).text
selector = parsel.Selector(html_data)
title = selector.css('h1.detail-one-tit::text').get().strip()  # 品牌
company = selector.css('p.detail-company::text').get()  # 公司
info = selector.css('div.detail-three-tit::text').getall()
value = selector.css('span.detail-option-value::text').getall()
dit = {


    '品牌': title,
    '公司': company,
    '业态类别': info[0],
    '拓展状态': info[1],
    '创立时间': value[0],
    '人均消费/客单价': value[1].strip(),
    '开店方式': value[2],
    '合作期限': value[3],
    '面积要求': value[4],
    '已进购物中心': value[5],
    '详情页': link,
}
# 写入数据
csv_writer.writerow(dit)
print(dit)
7、保存数据到表格
f = open('品牌.csv', mode='w', encoding='utf-8', newline='')
csv_writer = csv.DictWriter(f, fieldnames=[
    '品牌',
    '公司',
    '业态类别',
    '拓展状态',
    '创立时间',
    '人均消费/客单价',
    '开店方式',
    '合作期限',
    '面积要求',
    '已进购物中心',
    '详情页',
])
csv_writer.writeheader()
数据可视化部分
读取表格
import pandas as pd

df = pd.read_csv('data.csv')
df.head()
将’已进购物中心’列的数据类型转换为字符串,使用str.replace()方法去除’家’字符,并将’–'替换为0,然后再将数据类型转换为整数。
df['已进购物中心'] = df['已进购物中心'].astype(str).str.replace('家', '').str.replace('--', '0').astype(int)
通过将’人均消费/客单价’列的数据类型转换为字符串,使用str.replace()方法将’–‘替换为0,再使用str.split(’-')方法将字符串拆分为列表,并使用str.get(0)方法将取得列表中的第一个元素(即最低消费),最后将数据类型转换为整数。
df['人均消费'] = df['人均消费/客单价'].astype(str).str.replace('--', '0').str.split('-').str.get(0).astype(int)
通过将’人均消费/客单价’列的数据类型转换为字符串,使用str.replace()方法将’–‘替换为0,再使用str.split(’-')方法将字符串拆分为列表,并使用str.get(0)方法将取得列表中的第一个元素(即最低消费), 将数据类型转换为整数。
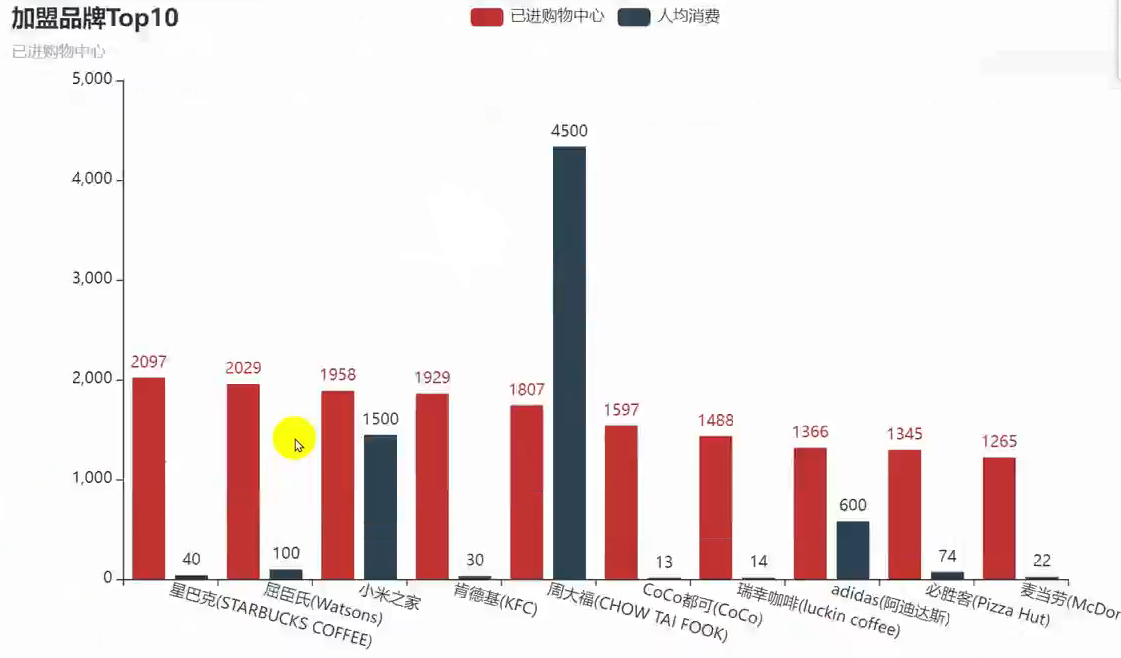
top10 = df[['品牌', '已进购物中心', '人均消费']].sort_values('已进购物中心', ascending=False)[:10]
ShopList = list(top10['品牌'])
counts = list(top10['已进购物中心'])
price = list(top10['人均消费'])
print(ShopList)
print(counts)
print(price)
使用已进购物中心和人均消费作为两个系列的数据做柱状图展示
from pyecharts import options as opts
from pyecharts.charts import Bar

c = (
    Bar()
    .add_xaxis(ShopList)
    .add_yaxis("已进购物中心", counts)
    .add_yaxis("人均消费", price)
    .set_global_opts(
        xaxis_opts=opts.AxisOpts(axislabel_opts=opts.LabelOpts(rotate=-15)),
        title_opts=opts.TitleOpts(title="加盟品牌Top10", subtitle="已进购物中心"),
    )
)
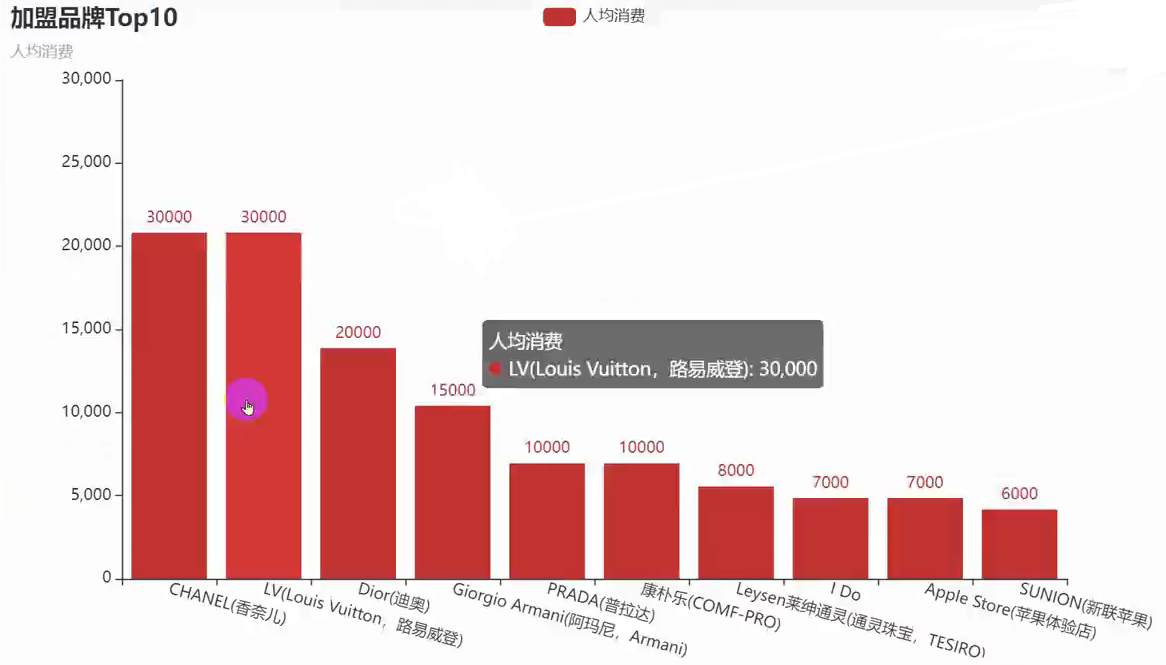
人均消费降序
top10 = df[['品牌', '人均消费']].sort_values('人均消费', ascending=False)[:10]
ShopList = list(top10['品牌'])
price = list(top10['人均消费'])
from pyecharts import options as opts
from pyecharts.charts import Bar

c = (
    Bar()
    .add_xaxis(ShopList)
    .add_yaxis("人均消费", price)
    .set_global_opts(
        xaxis_opts=opts.AxisOpts(axislabel_opts=opts.LabelOpts(rotate=-15)),
        title_opts=opts.TitleOpts(title="加盟品牌Top10", subtitle="人均消费"),
    )
)
c.render_notebook()
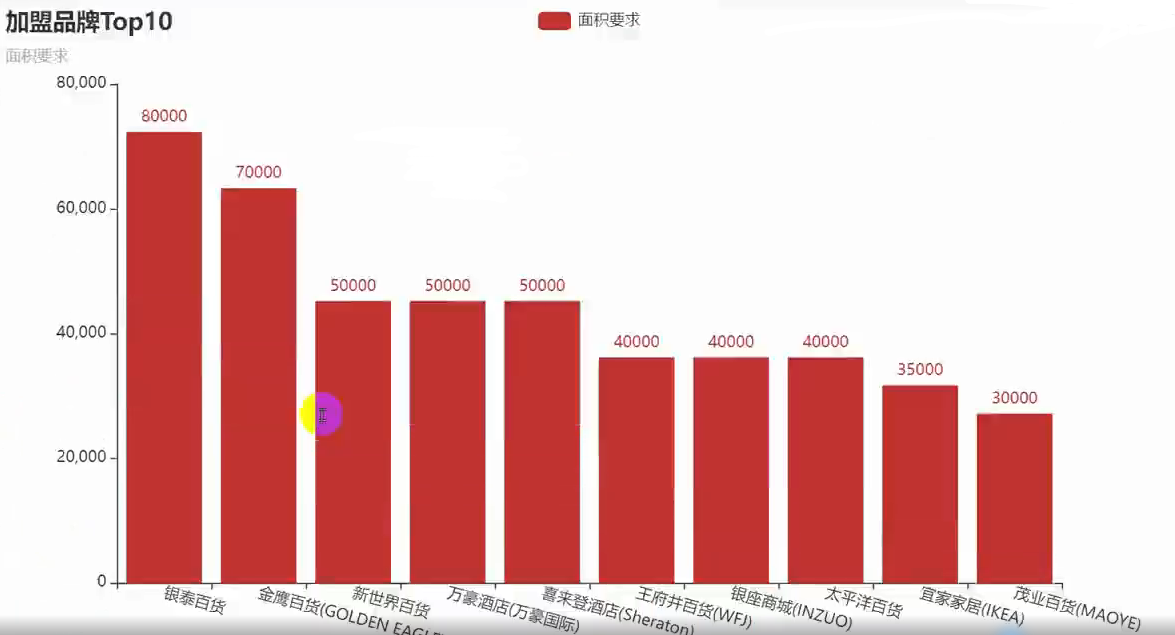
面积要求降序
df['面积要求'] = df['面积要求'].astype(str).str.replace('--', '0').str.split('-').str.get(0).astype(int)
top10 = df[['品牌', '面积要求']].sort_values('面积要求', ascending=False)[:10]
ShopList = list(top10['品牌'])
area = list(top10['面积要求'])
from pyecharts import options as opts
from pyecharts.charts import Bar

c = (
    Bar()
    .add_xaxis(ShopList)
    .add_yaxis("面积要求", area)
    .set_global_opts(
        xaxis_opts=opts.AxisOpts(axislabel_opts=opts.LabelOpts(rotate=-15)),
        title_opts=opts.TitleOpts(title="加盟品牌Top10", subtitle="面积要求"),
    )
)
c.render_notebook()
面积要求折线图
import pyecharts.options as opts
from pyecharts.charts import Line
from pyecharts.faker import Faker


c = (
    Line()
    .add_xaxis(ShopList)
    .add_yaxis("面积要求", area, is_connect_nones=True)
    .set_global_opts(title_opts=opts.TitleOpts(title="加盟品牌Top10-面积"))
#     .render("line_connect_null.html")
)
c.render_notebook()
开店方式饼状图
from pyecharts import options as opts
from pyecharts.charts import Pie
from pyecharts.faker import Faker

c = (
    Pie()
    .add(
        "",
        [
            list(z)
            for z in zip(types, nums)
        ],
        center=["40%", "50%"],
    )
    .set_global_opts(
        title_opts=opts.TitleOpts(title="开店方式"),
        legend_opts=opts.LegendOpts(type_="scroll", pos_left="80%", orient="vertical"),
    )
    .set_series_opts(label_opts=opts.LabelOpts(formatter="{b}: {c}"))
#     .render("pie_scroll_legend.html")
)
c.render_notebook()
好了今天的文章就分享到这里结束啦~
文章不过瘾?我还准备了视频进行详细讲解,文末名片自取,备注【LL】快速通过验证。
