import matplotlib.pyplot as plt
import numpy as np
plt.style.use('seaborn-darkgrid')
# make data
x = [1, 2, 3, 4, 5]
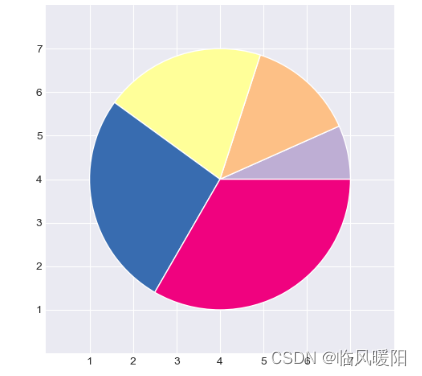
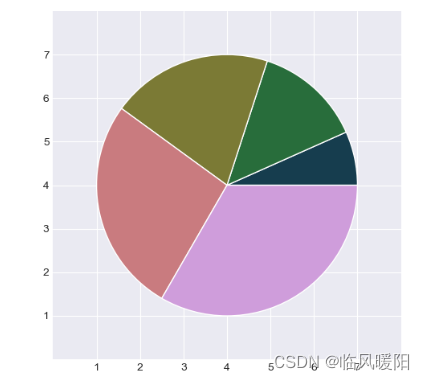
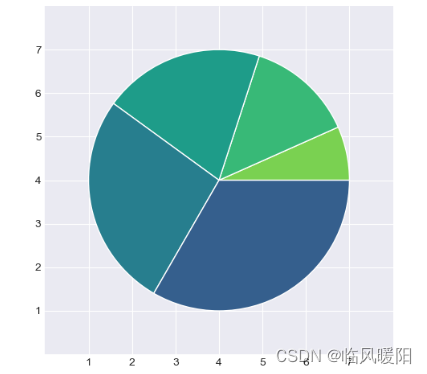
colors = plt.get_cmap('Accent')(np.linspace(0.2, 0.7, len(x)))
# plot
fig, ax = plt.subplots()
ax.pie(x, colors=colors, radius=3, center=(4, 4),
wedgeprops={
"linewidth": 1, "edgecolor": "white"}, frame=True)
ax.set(xlim=(0, 8), xticks=np.arange(1, 8),
ylim=(0, 8), yticks=np.arange(1, 8))
plt.show()
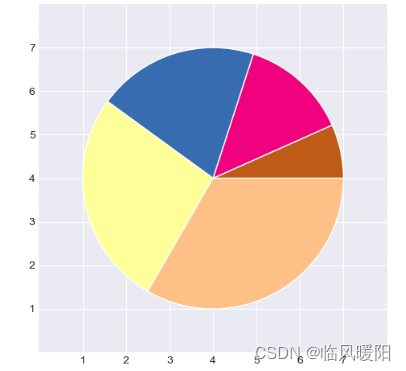
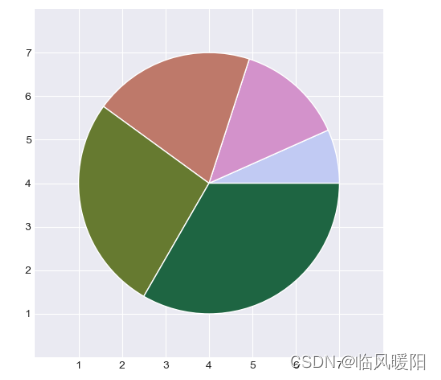
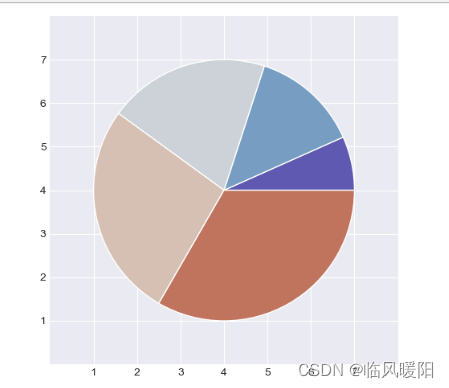
colors = plt.get_cmap('Accent_r')(np.linspace(0.2, 0.7, len(x)))
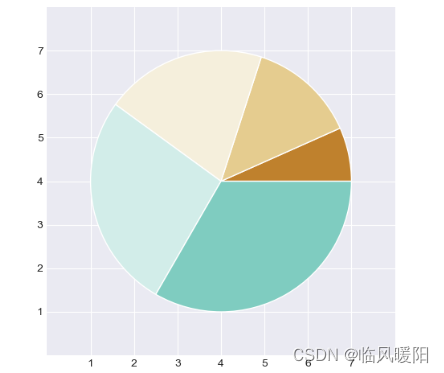
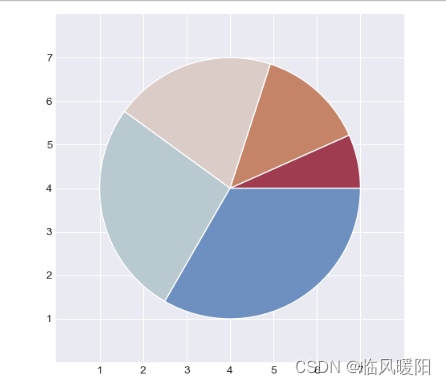
colors = plt.get_cmap('BrBG')(np.linspace(0.2, 0.7, len(x)))
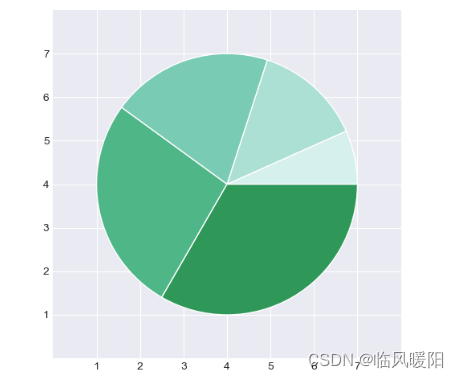
colors = plt.get_cmap('BuGn')(np.linspace(0.2, 0.7, len(x)))
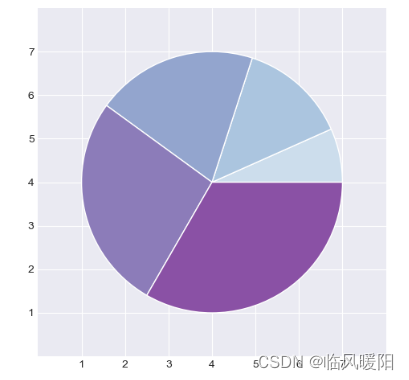
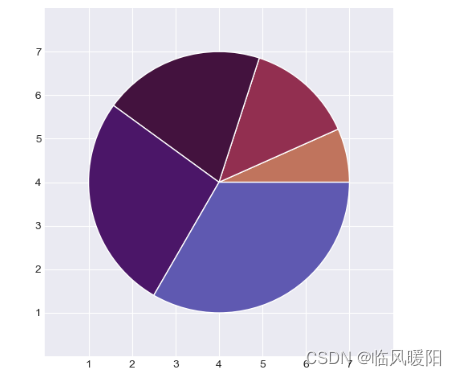
colors = plt.get_cmap('BuPu')(np.linspace(0.2, 0.7, len(x)))
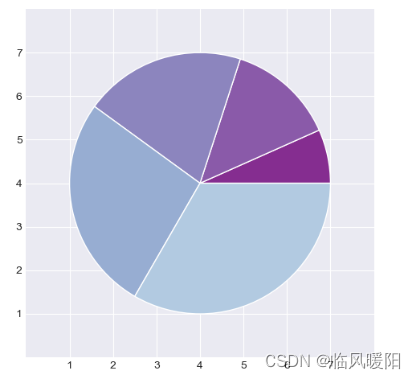
colors = plt.get_cmap('BuPu_r')(np.linspace(0.2, 0.7, len(x)))
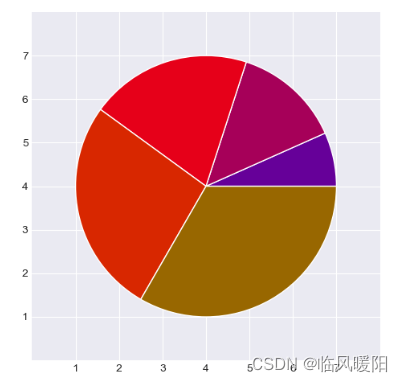
colors = plt.get_cmap('CMRmap')(np.linspace(0.2, 0.7, len(x)))
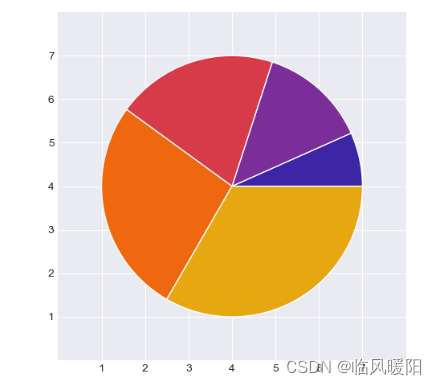
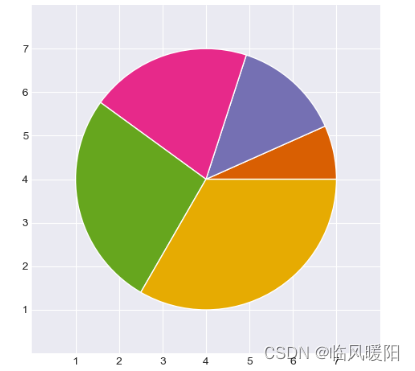
colors = plt.get_cmap('Dark2')(np.linspace(0.2, 0.7, len(x)))
colors = plt.get_cmap('cubehelix')(np.linspace(0.2, 0.7, len(x)))
colors = plt.get_cmap('cubehelix_r')(np.linspace(0.2, 0.7, len(x)))
colors = plt.get_cmap('flag')(np.linspace(0.2, 0.7, len(x)))
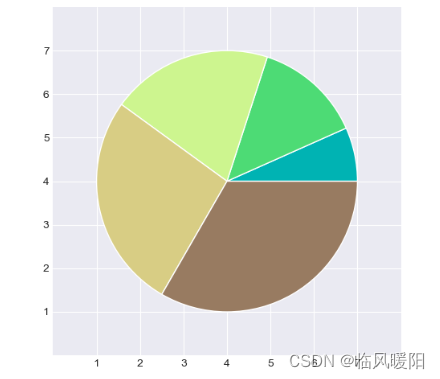
colors = plt.get_cmap('gist_earth')(np.linspace(0.2, 0.7, len(x)))
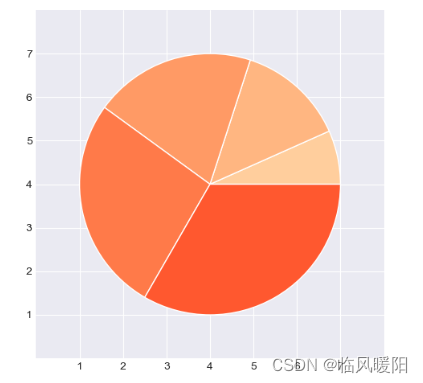
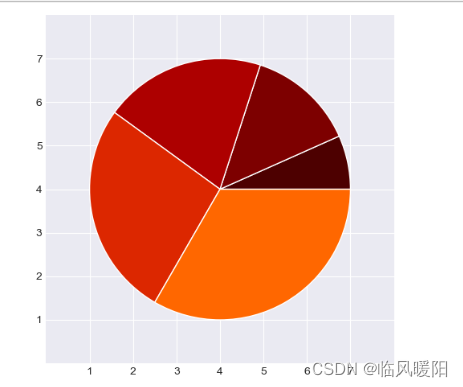
colors = plt.get_cmap('gist_heat')(np.linspace(0.2, 0.7, len(x)))
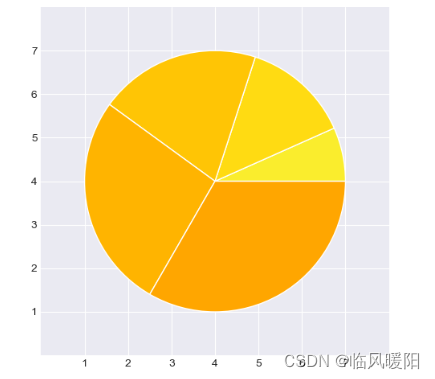
colors = plt.get_cmap('Wistia')(np.linspace(0.2, 0.7, len(x)))
colors = plt.get_cmap('terrain')(np.linspace(0.2, 0.7, len(x)))
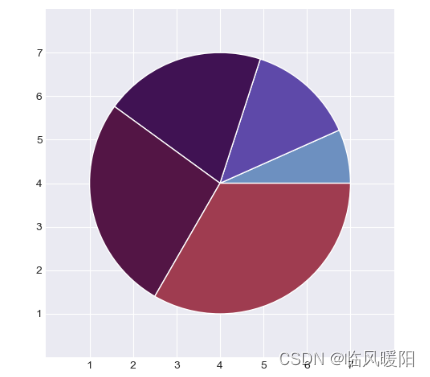
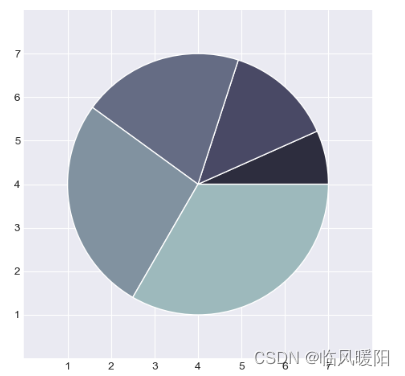
colors = plt.get_cmap('twilight')(np.linspace(0.2, 0.7, len(x)))
colors = plt.get_cmap('twilight_r')(np.linspace(0.2, 0.7, len(x)))
colors = plt.get_cmap('twilight_shifted')(np.linspace(0.2, 0.7, len(x)))
colors = plt.get_cmap('twilight_shifted_r')(np.linspace(0.2, 0.7, len(x)))
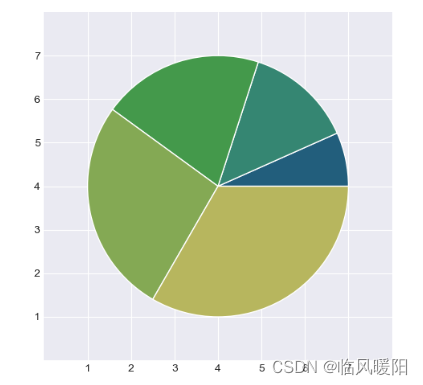
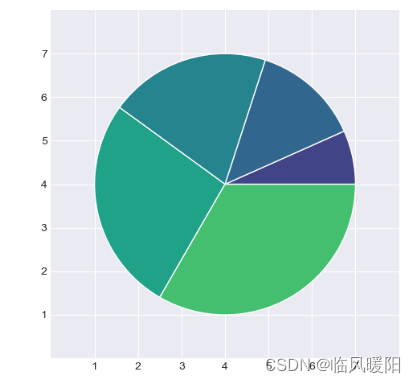
colors = plt.get_cmap('viridis')(np.linspace(0.2, 0.7, len(x)))
colors = plt.get_cmap('viridis_r')(np.linspace(0.2, 0.7, len(x)))
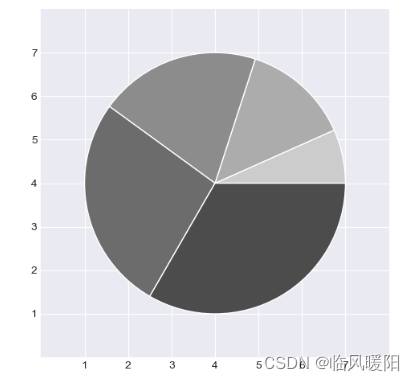
colors = plt.get_cmap('binary')(np.linspace(0.2, 0.7, len(x)))
colors = plt.get_cmap('bone')(np.linspace(0.2, 0.7, len(x)))
colors = plt.get_cmap('brg')(np.linspace(0.2, 0.7, len(x)))
参考文献:https://matplotlib.org/stable/plot_types/stats/pie.html
开发工具:Pycharm