问题描述
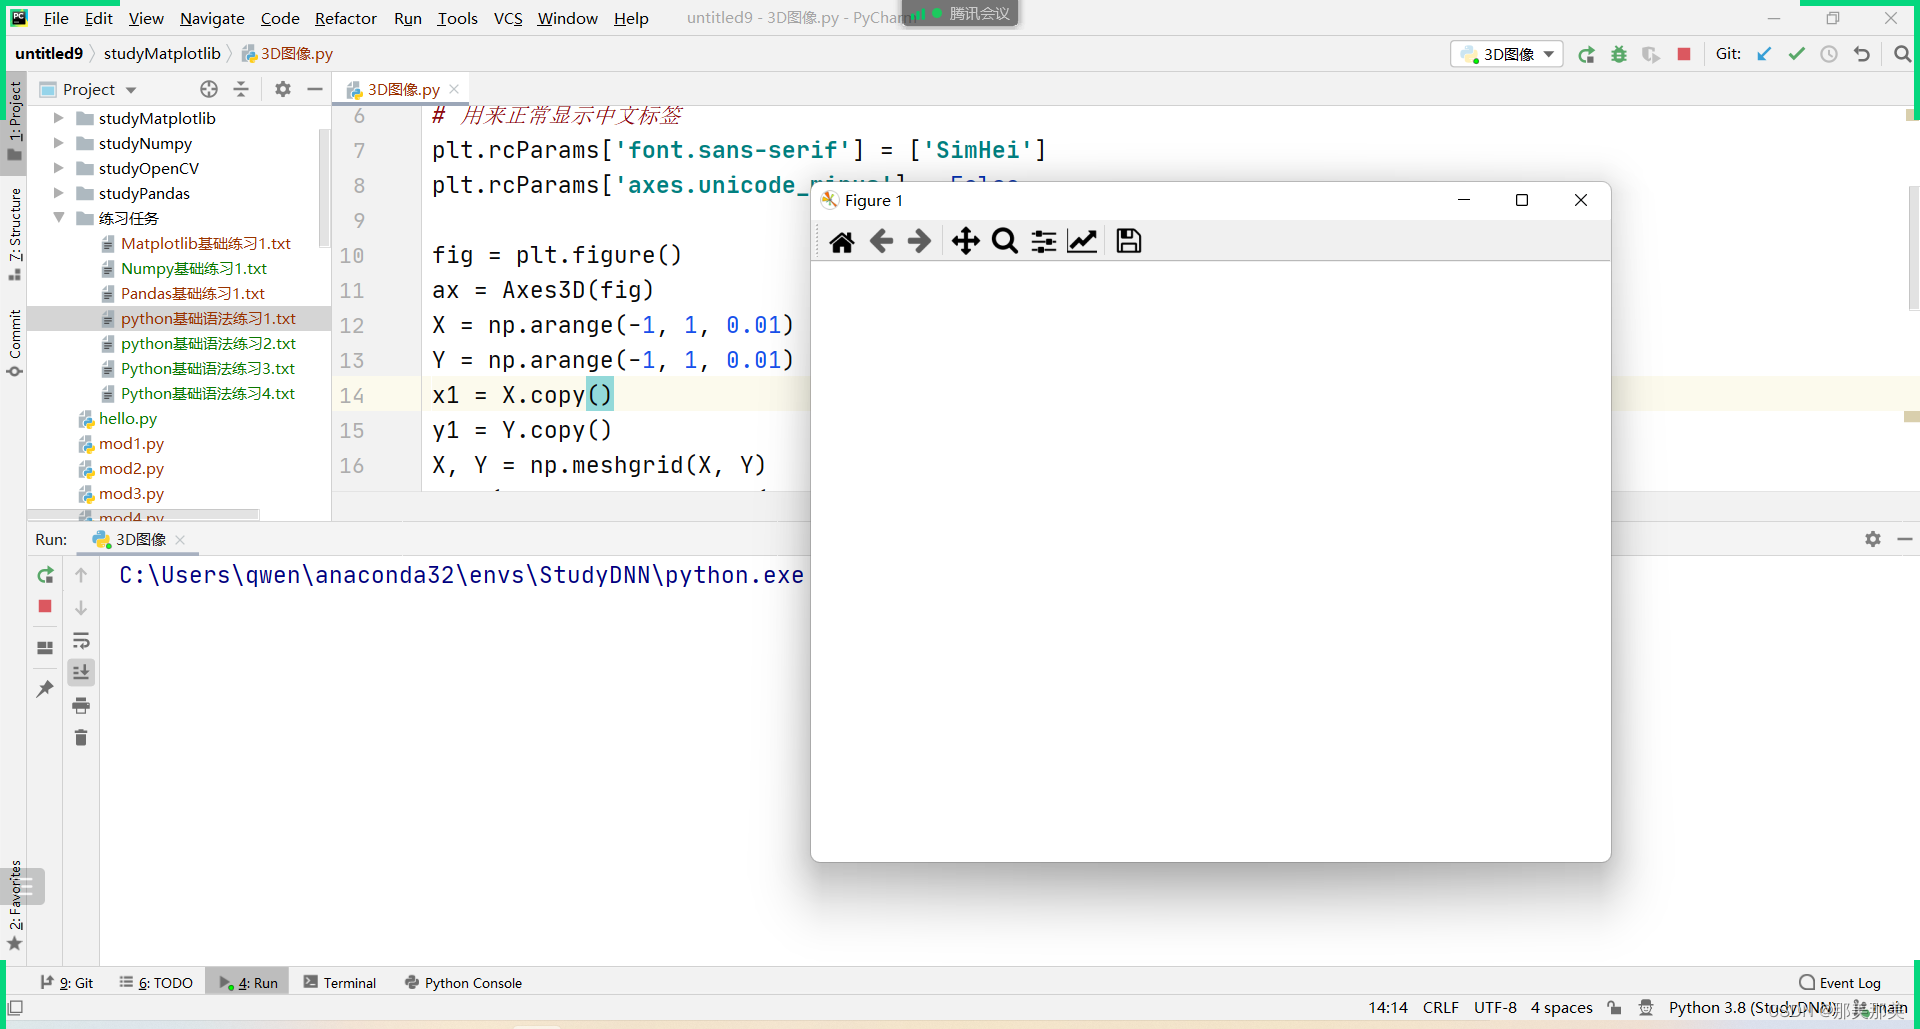
今天在使用matplotlib绘3D图像时,运行图像内容竟然显示为空:
# 第1章/studyMatplotlib/3D图像.py
import matplotlib.pyplot as plt
import numpy as np
from mpl_toolkits.mplot3d import Axes3D

# 用来正常显示中文标签
plt.rcParams['font.sans-serif'] = ['SimHei']
plt.rcParams['axes.unicode_minus'] = False

fig = plt.figure()
ax = Axes3D(fig)
X = np.arange(-1, 1, 0.01)
Y = np.arange(-1, 1, 0.01)
x1 = X.copy()
y1 = Y.copy()
X, Y = np.meshgrid(X, Y)
Z = (X ** 2 + Y ** 2 - (2 * X * Y))  # (x-y)**2
# 3d图像数据需要x,y,z 3个坐标
# rstride	数组行距(步长大小)
# cstride	数组列距(步长大小)
# color	    曲面块颜色映射
ax.plot_surface(X, Y, Z, rstride=1, cstride=1, cmap='rainbow')
plt.show()
# plt.savefig('3d_2图像')
运行结果:
原因分析:
很奇怪的是在另一个conda环境没有问题,因此我对比了两个环境中matplotlib的版本。
matplotlib 3.6.2不能够显示3D图像

matplotlib 3.4.3能够显示3D图像

正常结果:

`因此,可以确定是由于版本变化导致使用的方法有变化。
解决方案:
- 使用conda install matplotlib=3.4.3解决
- 后来查询将代码改为以下也可以解决
# ax = Axes3D(fig) # 原代码
ax = fig.add_axes(Axes3D(fig)) # 新代码
jiaV = "qwentest123"

# 3.使用三引号。
hotSrh = """
1学测试开发只要60天
2学BI数据开发只要30天
3学人工智能只要60天
4以上全是零基础
5中科院博士把关!"""
总结
-
以上代码示例部分来自我写的《Python软件测试实战宝典》 的内容,有兴趣,行动起来立马入手一本(各平台均有)。
-
挑战零基础60天,入行软件测试、BI数据分析、人工智能请找“智谷一川,qwentest123” 。
