性能监控一直是前端的一个重点工作,本文介绍在做性能监控时,必须要了解的一个Web API——performance,主要了解它的的属性和使用。
一、window.performance
1、Performance 是一个标准,用于解决开发者在浏览器中获取性能数据的问题。
2、Performance 同时也是一个浏览器全局对象,提供了一组 API 用于获取程序在某些节点的性能数据。它包含一组高精度时间定义,以及配套的相关方法。
通过performance对象可以获取到当前页面中与性能相关的信息。
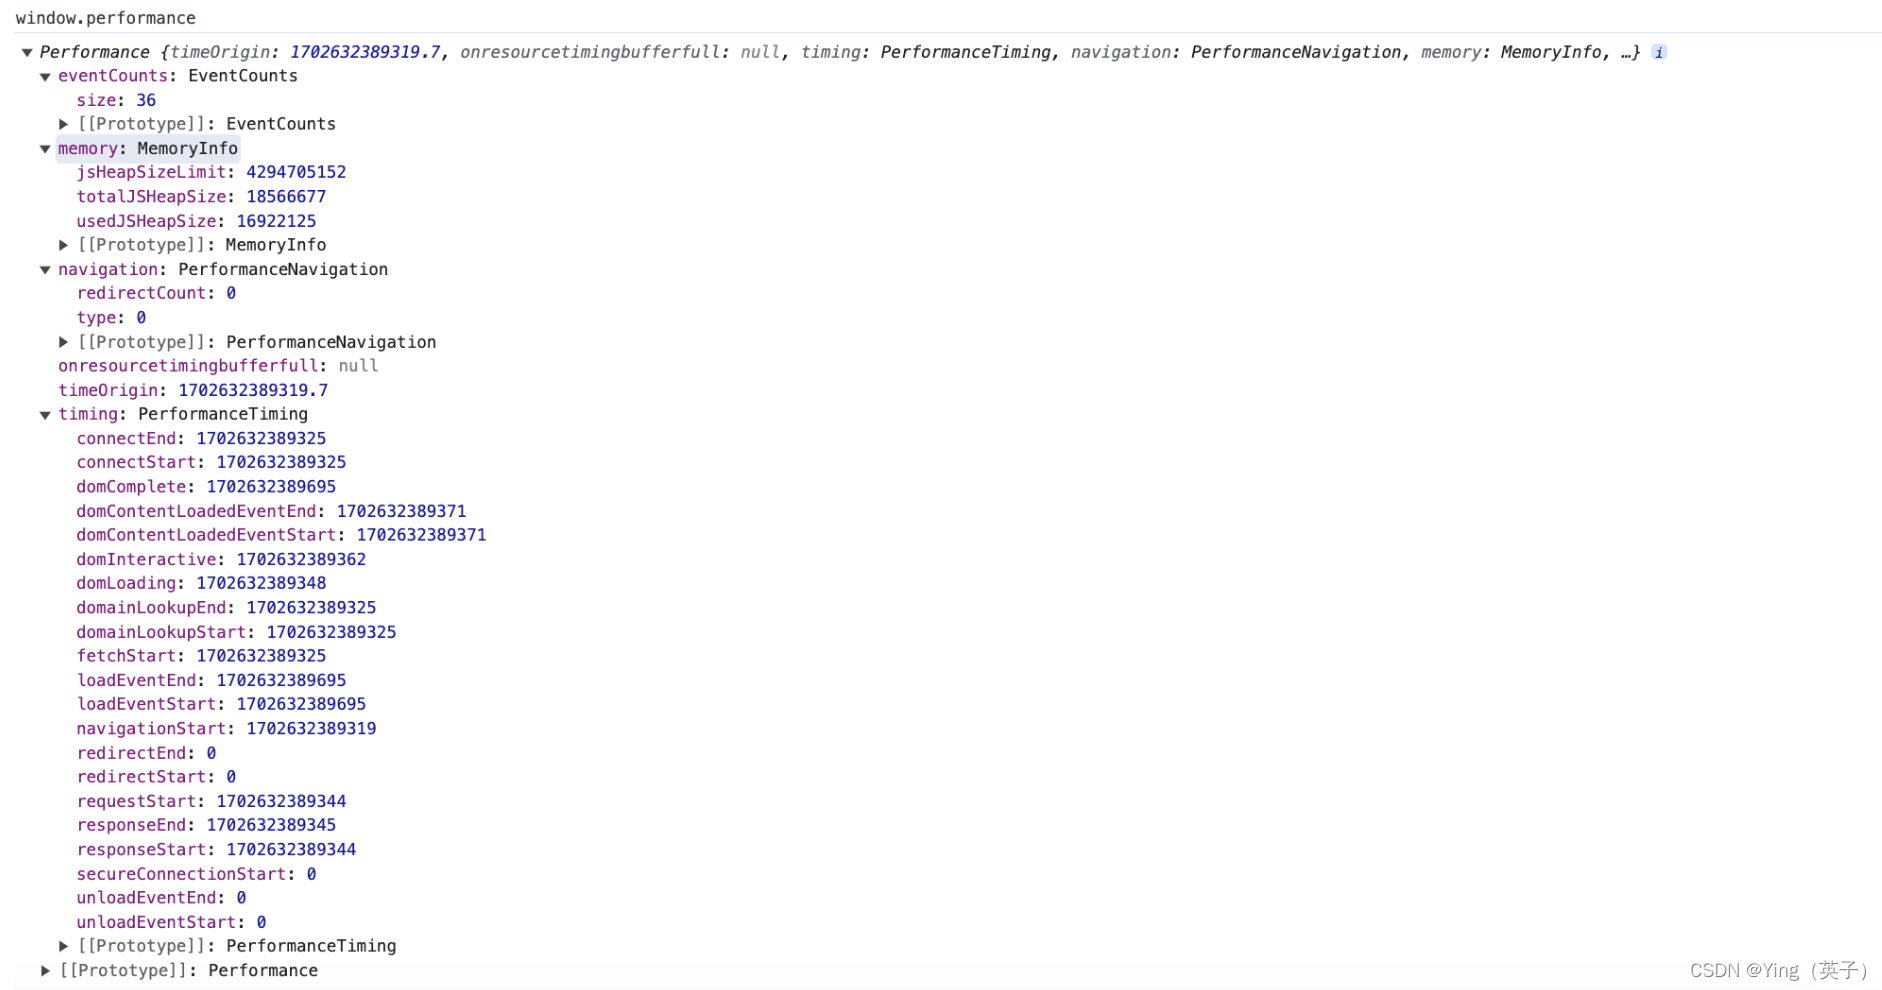
属性值说明
-
eventCounts:记录了所有已经分发过的 Event,处理时间是否大于 50ms。 -
memory: 记录内存属性- usedJSHeapSize,JS 对象(包括V8引擎内部对象)占用的内存
- totalJSHeapSize,可使用的内存
- jsHeapSizeLimit,内存大小限制
-
navigation:返回一个 PerformanceNavigation 对象,这个对象表示出现在当前浏览上下文的 navigation 类型,比如获取某个资源所需要的重定向次数- redirectCount:只读,表示在到达这个页面之前重定向了多少次
- onresourcetimingbufferfull:当浏览器的资源时间性能缓冲区已满时会触发
- type:表示是如何导航到这个页面的,一般用来检测页面时如何跳转过来的。
| 值 | 含义 |
|---|---|
| 0 | 当前页面是通过点击链接,书签和表单提交,或者脚本操作,或者在url中直接输入地址,type值为0 |
| 1 | 点击刷新页面按钮或者通过window.location.reload() 方法显示的页面 |
| 2 | 页面通过历史记录和前进后退访问时 |
| 255 | 其他方式进入的页面 |
-
timeOrigin:返回性能测量开始时的时间的高精度时间戳。 -
timing:最重要的属性,包含了网络、解析等一系列的时间数据,常用于页面性能分析。一张图来了解timing,如下:
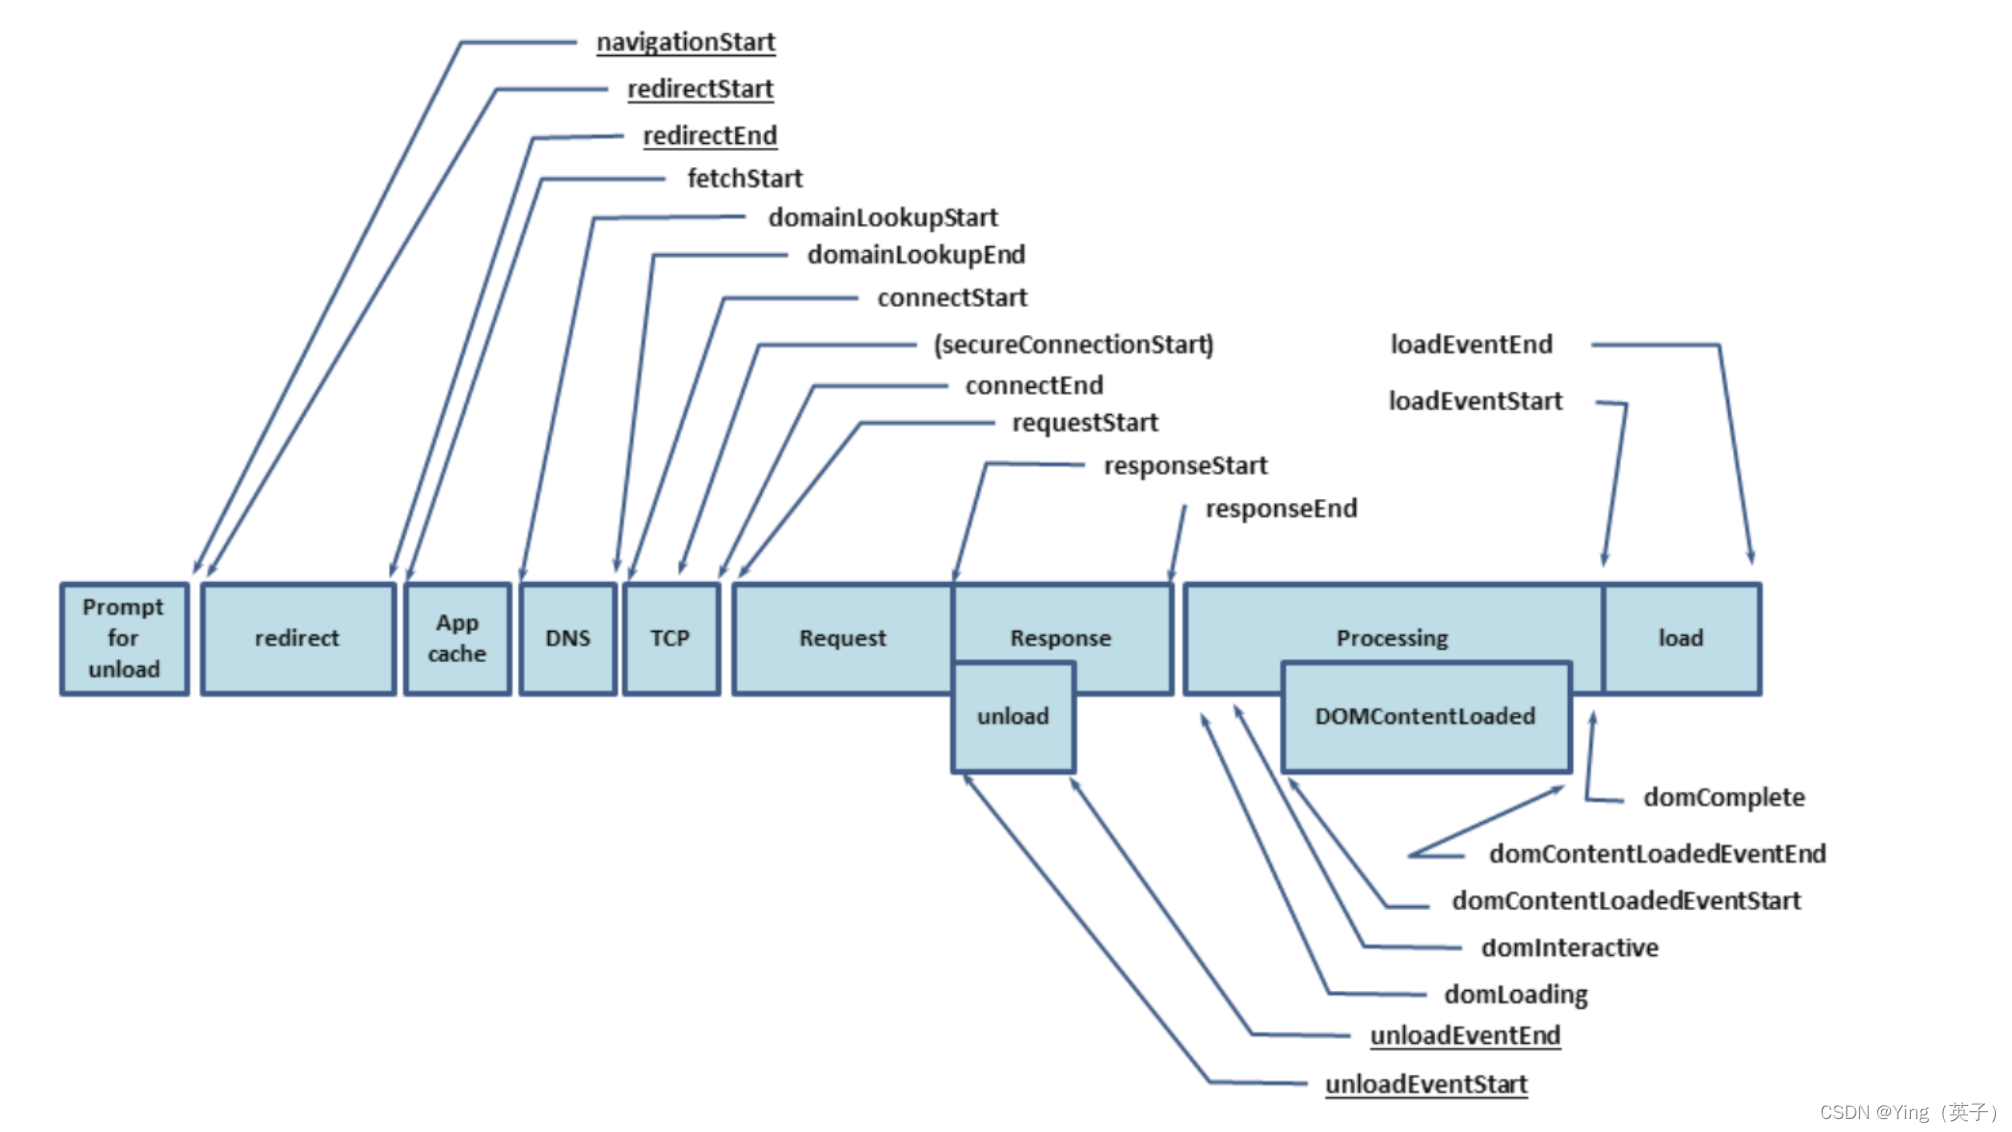
常用性能指标计算公式: -
DNS查询耗时 = domainLookupEnd - domainLookupStart
-
TCP链接耗时 = connectEnd - connectStart
-
request请求耗时 = responseEnd - responseStart
-
解析dom树耗时 = domComplete - domInteractive
-
白屏时间 = domloading - fetchStart
-
domready时间 = domContentLoadedEventEnd - fetchStart
-
onload时间 = loadEventEnd - fetchStart
使用注意事项:
因为很多值必须在页面完全加载之后才能得出,建议最好在window.onload事件中读取各种数据。
使用示例:
// 兼容性写法
const performance = window.performance || window.msPerformance || window.webkitPerformance;

const timing = performance && performance.timing;
const navigation = performance && performance.navigation;

// DNS 解析耗时
const dns = timing.domainLookupEnd - timing.domainLookupStart;

// TCP 链接耗时
const conn = timing.connectEnd - timing.connectStart;

// 等待服务器响应耗时(注意是否存在cache)
const request = timing.responseStart - timing.requestStart;

// 内容加载耗时(注意是否存在cache)
const response = timing.responseEnd - timing.responseStart;

// 总体网络交互耗时,即开始跳转到服务器资源下载完成
const network = timing.responseEnd - timing.navigationStart;

// 渲染处理
const processing = (timing.domComplete || timing.domLoading) - timing.domLoading;

// 抛出load事件
const load = timing.loadEventEnd - timing.loadEventStart;

// 总耗时
const total =
  (timing.loadEventEnd || timing.loadEventStart || timing.domComplete || timing.domLoading) -
  timing.navigationStart;

// 可交互
const active = timing.domInteractive - timing.navigationStart;

// 请求响应耗时,即T0,注意cache
const t0 = timing.responseStart - timing.navigationStart;

// 首次出现内容,即T1
const t1 = timing.domLoading - timing.navigationStart;

// 内容加载完毕,即T3
const t3 = timing.loadEventEnd - timing.navigationStart;

// 重定向次数
const redirectCount = navigation && navigation.redirectCount;

// 跳转耗时
const redirect = timing.redirectEnd - timing.redirectStart;

// APP CACHE 耗时
const appcache = Math.max(timing.domainLookupStart - timing.fetchStart, 0);
更多属性说明可参看:https://segmentfault.com/a/1190000040912772
二、performance.getEntries()
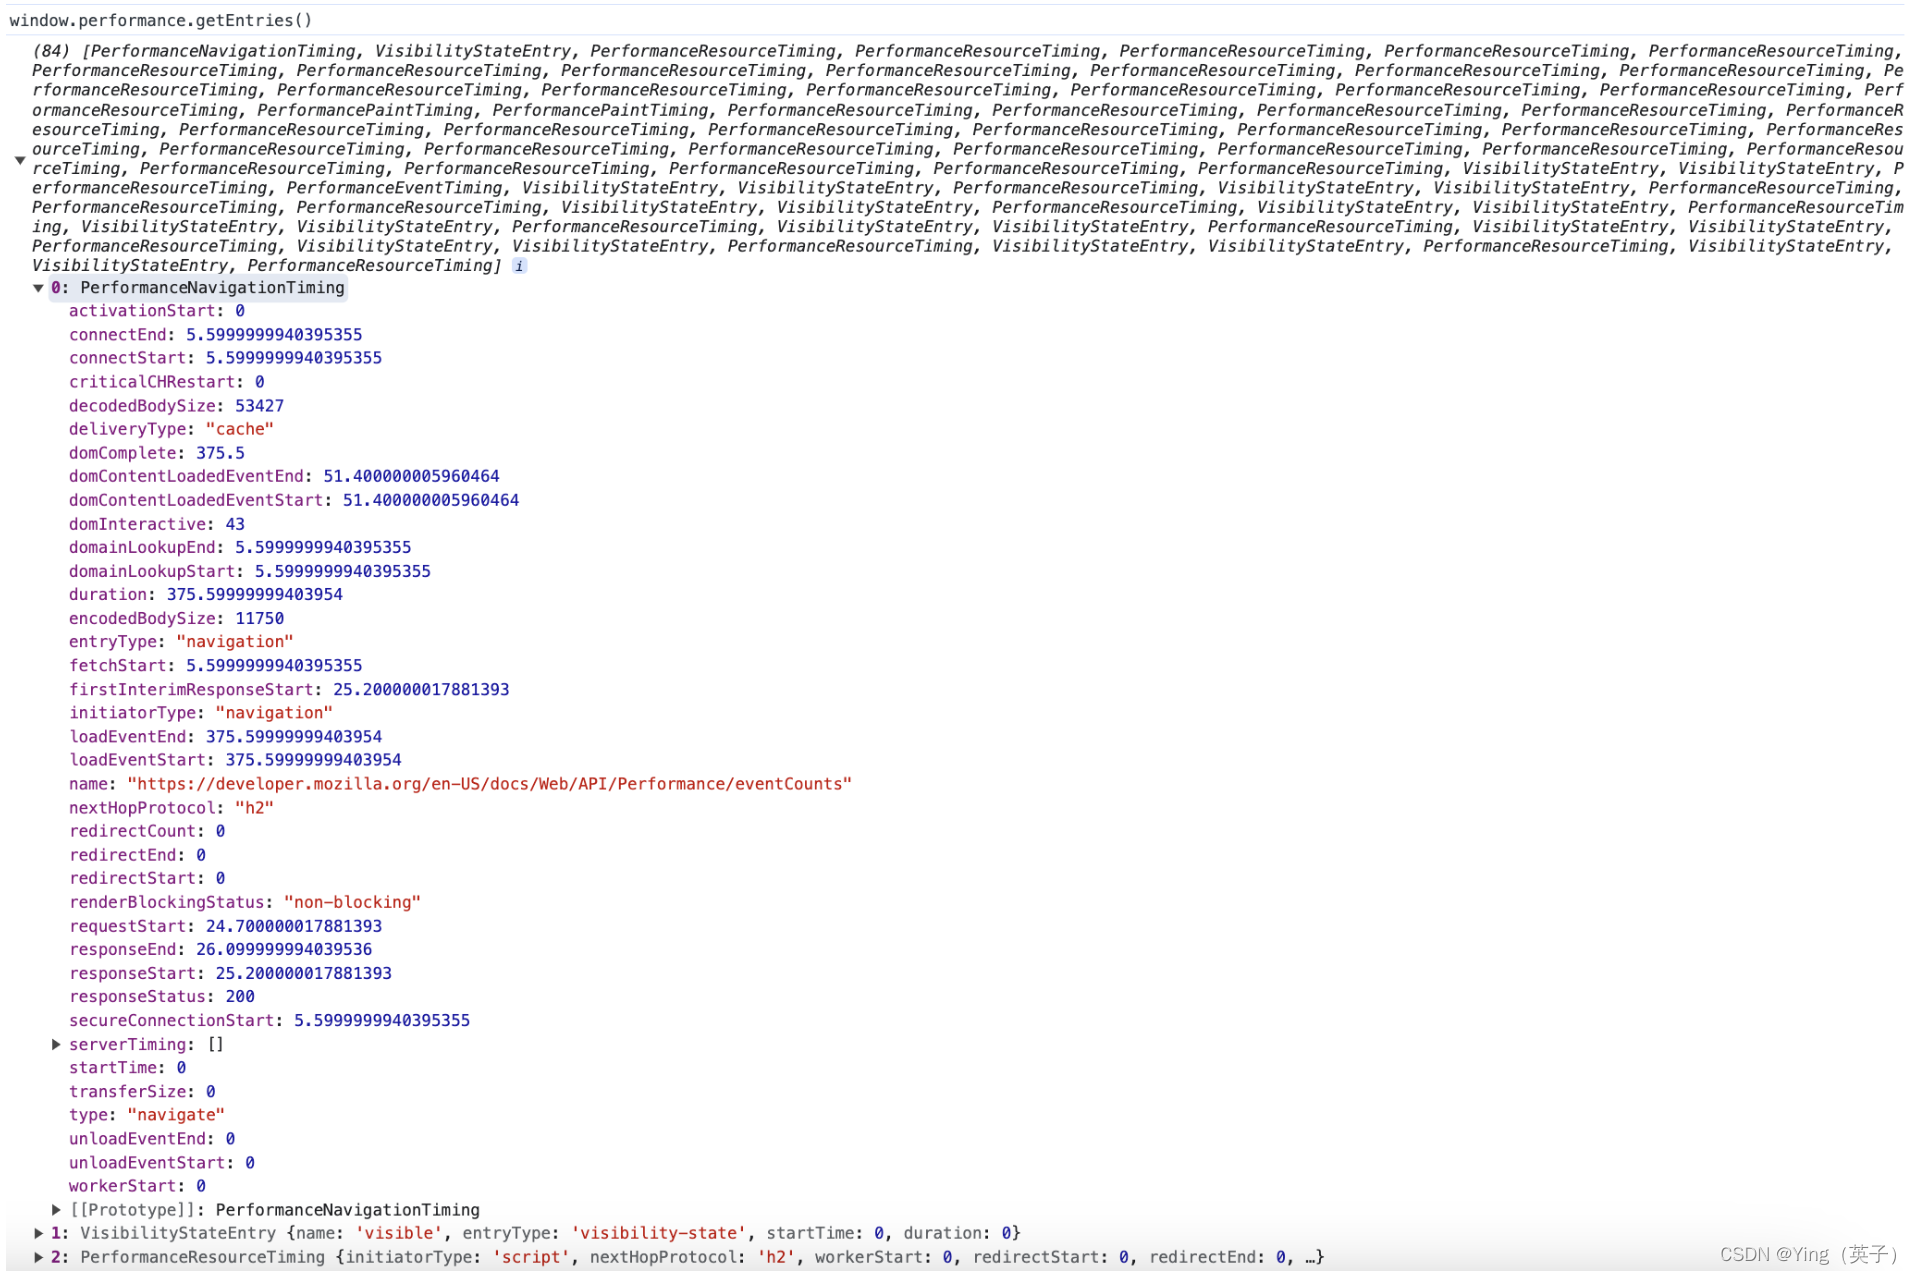
window.performance.getEntries() 返回一个数组,数组的每个元素代表对应的静态资源的信息。
数组的第一个元素结果相当于:window.performance.getEntriesByType('navigation')
window.performance.getEntries() 执行结果:
window.performance.getEntriesByType(‘navigation’) 执行结果:
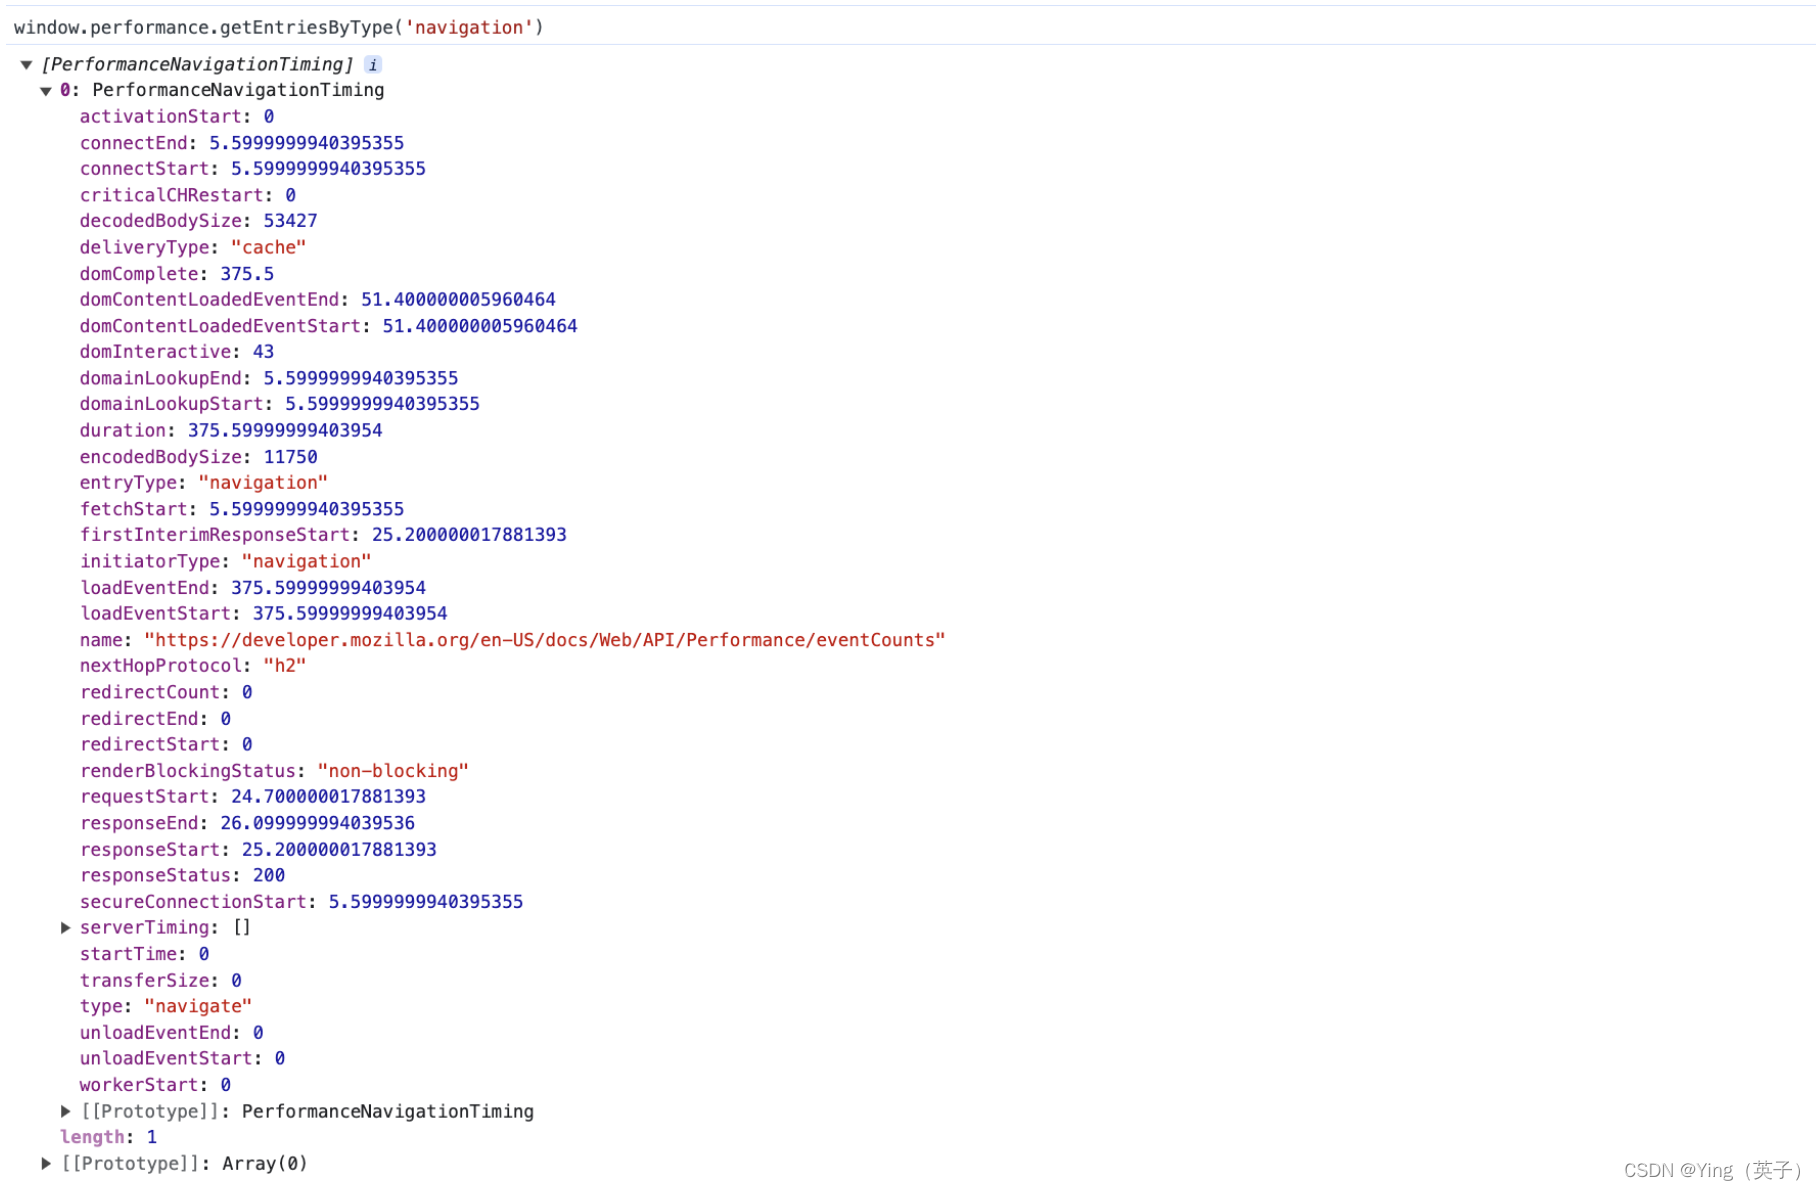
发现其实是一样的!
重要属性说明:
duration:资源的总耗时(包括等待时长,请求时长,响应时长 相当于responseEnd - startTime)initiatorType:初始类型(注意这个类型并不准确,例如在css中的图片资源会这个值显示css,所以还是推荐用name中的后缀名)name:资源的链接transferSize: 转换后的文件大小(略大于encodedBodySize,这个值是和chrome的devtool Network里的size一致)
PS:了解更多可点击查看 使用 Performance API 获取页面性能 、参考文章