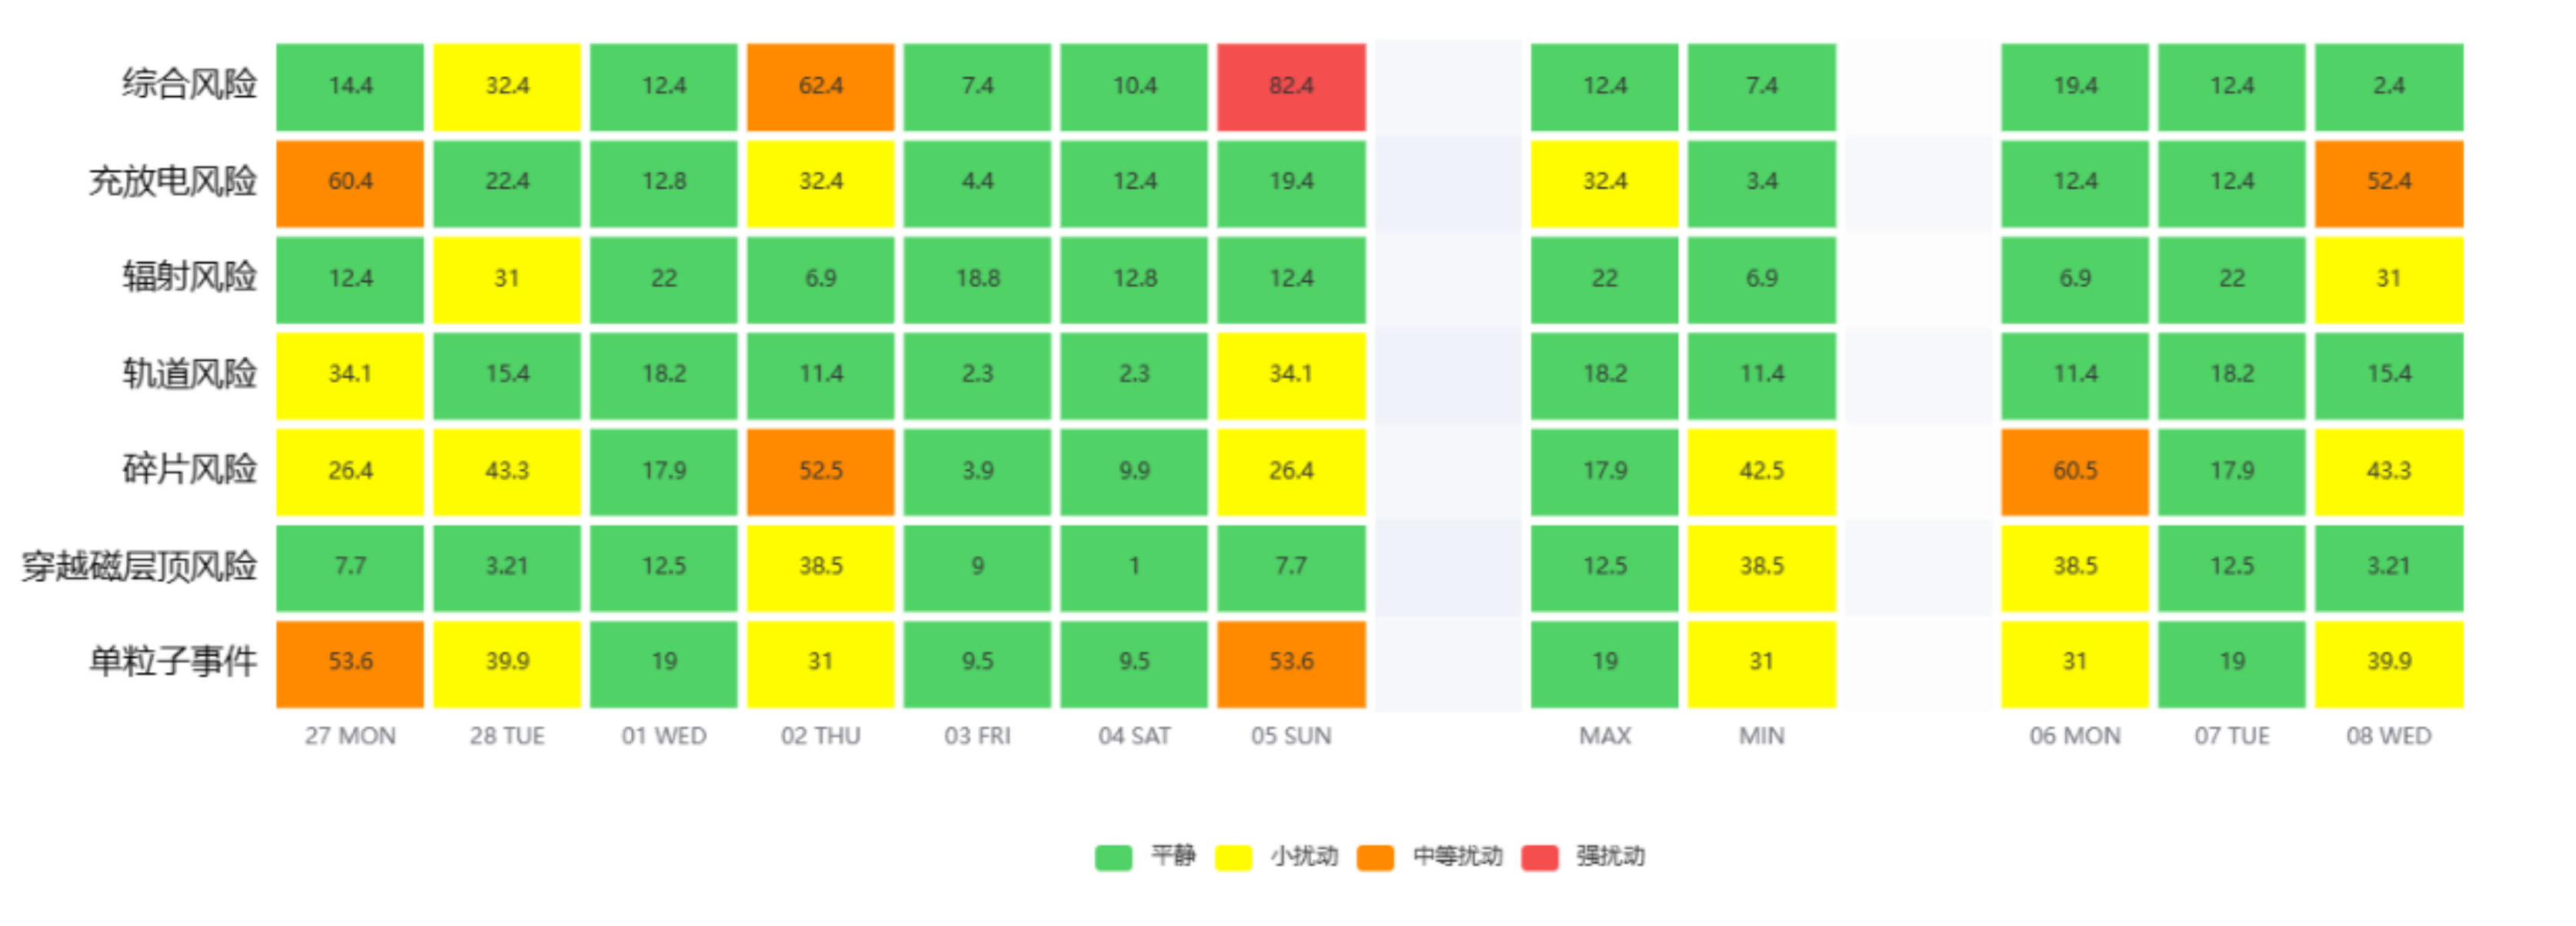
Echarts 绘制自定义热力图

文章目录

需求

用Echarts 绘制自定义热力图

在这里插入图片描述

分析

源码

<!DOCTYPE html>
<html>
  <head>
    <meta charset="utf-8"/>
    <title>源码</title>
    <!-- 引入刚刚下载的 ECharts 文件 -->
    <script src="js/echarts.js"></script>
  </head>
  <body>
    <!-- 为 ECharts 准备一个定义了宽高的 DOM -->
    <div id="main" style="width: 100%;height:600px;"></div>
    <script type="text/javascript">
      // 基于准备好的dom,初始化echarts实例
      // 1、初始化
      var themeColors = 'light';
      // var themeColors = 'dark';
      let view = document.getElementById('main');
      let mychart = echarts.init(view, themeColors);

      var date = [
        '27 MON',
        '28 TUE',
        '01 WED',
        '02 THU',
        '03 FRI',
        '04 SAT',
        '05 SUN',
        '',
        'MAX',
        'MIN',
        '',
        '06 MON',
        '07 TUE',
        '08 WED',
      ];
      var categoryName = [
        '单粒子事件',
        '穿越磁层顶风险',
        '碎片风险',
        '轨道风险',
        '辐射风险',
        '充放电风险',
        '综合风险',
      ];

      var data = [
        [
          0, 0, 53.6
        ],
        [
          0, 1, 7.7
        ],
        [
          0, 2, 26.4
        ],
        [
          0, 3, 34.1
        ],
        [
          0, 4, 12.4
        ],
        [
          0, 5, 60.4
        ],
        [
          0, 6, 14.4
        ],

        [
          1, 0, 39.9
        ],
        [
          1, 1, 3.21
        ],
        [
          1, 2, 43.3
        ],
        [
          1, 3, 15.4
        ],
        [
          1, 4, 31.0
        ],
        [
          1, 5, 22.4
        ],
        [
          1, 6, 32.4
        ],

        [
          2, 0, 19.0
        ],
        [
          2, 1, 12.5
        ],
        [
          2, 2, 17.9
        ],
        [
          2, 3, 18.2
        ],
        [
          2, 4, 22.0
        ],
        [
          2, 5, 12.8
        ],
        [
          2, 6, 12.4
        ],

        [
          3, 0, 31.0
        ],
        [
          3, 1, 38.5
        ],
        [
          3, 2, 52.5
        ],
        [
          3, 3, 11.4
        ],
        [
          3, 4, 6.9
        ],
        [
          3, 5, 32.4
        ],
        [
          3, 6, 62.4
        ],

        [
          4, 0, 9.5
        ],
        [
          4, 1, 9.0
        ],
        [
          4, 2, 3.9
        ],
        [
          4, 3, 2.3
        ],
        [
          4, 4, 18.8
        ],
        [
          4, 5, 4.4
        ],
        [
          4, 6, 7.4
        ],

        [
          5, 0, 9.5
        ],
        [
          5, 1, 1.0
        ],
        [
          5, 2, 9.9
        ],
        [
          5, 3, 2.3
        ],
        [
          5, 4, 12.8
        ],
        [
          5, 5, 12.4
        ],
        [
          5, 6, 10.4
        ],

        [
          6, 0, 53.6
        ],
        [
          6, 1, 7.7
        ],
        [
          6, 2, 26.4
        ],
        [
          6, 3, 34.1
        ],
        [
          6, 4, 12.4
        ],
        [
          6, 5, 19.4
        ],
        [
          6, 6, 82.4
        ],

        [
          7, 0
        ],
        [
          7, 1
        ],
        [
          7, 2
        ],
        [
          7, 3
        ],
        [
          7, 4
        ],
        [
          7, 5
        ],
        [
          7, 6
        ],

        [
          8, 0, 19.0
        ],
        [
          8, 1, 12.5
        ],
        [
          8, 2, 17.9
        ],
        [
          8, 3, 18.2
        ],
        [
          8, 4, 22.0
        ],
        [
          8, 5, 32.4
        ],
        [
          8, 6, 12.4
        ],

        [
          9, 0, 31.0
        ],
        [
          9, 1, 38.5
        ],
        [
          9, 2, 42.5
        ],
        [
          9, 3, 11.4
        ],
        [
          9, 4, 6.9
        ],
        [
          9, 5, 3.4
        ],
        [
          9, 6, 7.4
        ],

        [
          10, 0,
        ],
        [
          10, 1,
        ],
        [
          10, 2,
        ],
        [
          10, 3,
        ],
        [
          10, 4,
        ],
        [
          10, 5
        ],
        [
          10, 6
        ],

        [
          11, 0, 31.0
        ],
        [
          11, 1, 38.5
        ],
        [
          11, 2, 60.5
        ],
        [
          11, 3, 11.4
        ],
        [
          11, 4, 6.9
        ],
        [
          11, 5, 12.4
        ],
        [
          11, 6, 19.4
        ],

        [
          12, 0, 19.0
        ],
        [
          12, 1, 12.5
        ],
        [
          12, 2, 17.9
        ],
        [
          12, 3, 18.2
        ],
        [
          12, 4, 22.0
        ],
        [
          12, 5, 12.4
        ],
        [
          12, 6, 12.4
        ],

        [
          13, 0, 39.9
        ],
        [
          13, 1, 3.21
        ],
        [
          13, 2, 43.3
        ],
        [
          13, 3, 15.4
        ],
        [
          13, 4, 31.0
        ],
        [
          13, 5, 52.4
        ],
        [
          13, 6, 2.4
        ],

      ];
      // 2、参数
      option = {
      
      
        // 提示信息所在的页面位置
        tooltip: {
      
      
          position: 'top'
        },
        // 是否开启动画
        animation: false,
        // 画布网格大小。位置
        grid: {
      
      
          height: '60%',
          top: '10%'
        },
        // X坐标轴
        xAxis: {
      
      
          axisLine: {
      
      
            show: false
          },
          axisTick: {
      
      
            show: false
          },
          type: 'category',
          data: date,
          // 坐标轴分割区域
          splitArea: {
      
      
            show: true
          },
          // 坐标轴刻度的颜色
          // axisTick: {
      
      
          // lineStyle: {
      
      
          //     color: '#c4c4c4'
          // }
          // },
          axisLabel: {
      
       // 刻度之间的距离
            textStyle: {
      
      
              align: 'center' // 刻度居中显示
            }
          }
        },
        yAxis: {
      
      
          type: 'category',
          data: categoryName,
          splitArea: {
      
      
            show: true
          },
          axisTick: {
      
      
            show: false
          },
          axisLabel: {
      
       // formatter: '{value} °C', // 自定义纵坐标标签格式
            textStyle: {
      
      
              color: 'black', // 自定义纵坐标标签颜色
              fontSize: 18 // 自定义纵坐标标签字体大小
            }
          }
        },
        visualMap: {
      
      
          // show: false, // 是否展示图例信息
          type: 'piecewise', // 定义为分段型 visualMap
          min: 0,
          max: 100,
          splitNumber: 4, // 平均分为4段,默认分为5段
          calculable: true,
          orient: 'horizontal',
          left: 'center',
          bottom: '15%',
          color: [
            '#f54e4e', '#ff8a00', '#fffc00', '#50d266'
          ],
          // 对图例进行自定义格式化展示的内容
          formatter: function (value, value2) {
      
      
            if (value + value2 === 25) {
      
      
              return '平静'; // 范围标签显示内容。
            } else if (value + value2 === 75) {
      
      
              return '小扰动'; // 范围标签显示内容。
            } else if (value + value2 === 125) {
      
      
              return '中等扰动'; // 范围标签显示内容。
            } else if (value + value2 === 175) {
      
      
              return '强扰动'; // 范围标签显示内容。
            }
          }
        },
        series: [
          {
      
      
            name: '',
            type: 'heatmap',
            data: data,
            label: {
      
      
              show: true
            },
            // 设置页面中的间隔
            itemStyle: {
      
      
              themeColors,
              borderWidth: 5,
              borderColor: '#fff'
            },
            label: {
      
      
              show: true
            },
            emphasis: {
      
      
              itemStyle: {
      
      
                shadowBlur: 10,
                shadowColor: 'rgba(0, 0, 0, 0.5)'
              }
            }

          }
        ]
      };

      // 3、设置参数,类似于挂载
      mychart.setOption(option);


      function fetchData() {
      
      
        listQuery.value.pageNo = listQuery.value.page;
        getInfo(listQuery.value).then((res) => {
      
      
          listQuery.value.total = res.data.total;
          // 获取列表信息
          tableData.value = res.data.records;
          if (tableData.value.length === 0 && listQuery.value.pageNo > 1) {
      
       // 这页数据没有,查找上一页
            listQuery.value.pageNo -= 1;
            fetchData(); // 初始化列表
          }
          if (total.value > listQuery.value.pageNo * listQuery.value.pageSize) {
      
      
            listQuery.value.pageNo = Math.ceil((total.value + 1) / listQuery.value.pageSize);
            fetchData(); // 初始化列表
          }
        })
      }
    </script>
  </body>
</html>

猜你喜欢

转载自blog.csdn.net/qq_53810245/article/details/129387540
今日推荐