代码总览
% 设置自变量与因变量
x = -2*pi:pi/100:2*pi;
y_1 = sin(x);
y_2 = cos(x);
% 绘图
p1 = plot(x,y_1);
hold on
p2 = plot(x,y_2);
hold on
% 添加图像信息
xlabel('x','FontSize',15);
ylabel('y','FontSize',15);
title('三角函数图','FontSize',15);
%添加标签
legend([p1,p2],'sin(x)','cos(x)','FontSize',12,'TextColor','blue');
% legend('boxoff'); %关闭标签栏的框和背景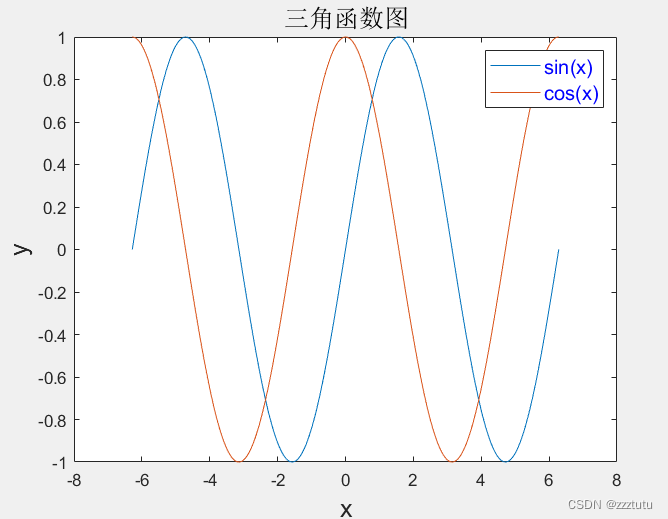
1.设置自变量范围
x = 下界:步长:上界
2.绘图常用
- hold on : 一图窗多线条常用
- 'FontSize' : 用于修改文字大小
3.legend设置标签
legend([p1,p2],'sin(x)','cos(x)','FontSize',12,'TextColor','blue');-
[p1,p2,p3]:图像向量 -
'm=1','m=2','m=3':图像标签【要按图像顺序写】 -
'FontSize':大小 -
'TextColor':文字颜色
`legend("boxoff")`关闭标签栏的背景和框