使用mallinfo确定是否有内存泄露:
static struct mallinfo mi1,mi2;
static struct timeval oldTime, currentTime;
#define MALLOC_STAT_TIME (60)
void sk_factory_test_malloc_stat(void)
{
gettimeofday (¤tTime, NULL );
if(currentTime.tv_sec-oldTime.tv_sec >= MALLOC_STAT_TIME)
{
mi2=mallinfo();
printf("consumed %d, used %d, sbrk mem %d\n", mi2.uordblks - mi1.uordblks, mi2.uordblks, mi2.arena);
mi1 = mi2;
}
}
在线程中调用函数,大概一分钟调用一次,测试结果显示:
consumed 44760, used 3294120, free blocks 8, sbrk mem 3563520
也就是一分钟泄露44760个字节,一天大概泄露61M
如何确定泄露的位置?
1.使用AddressSanitizer
条件:需要gcc版本大于4.8, 查看gcc版本arm-linux-gcc -v
gcc version 4.8.4 20141110 (prerelease) (Broadcom stbgcc-4.8-1.2)
符合条件
添加编译选项:
CFLAGS += -g -fsanitize=address
LDFLAGS += -fsanitize=address
-g选项不是必须的,但是能够更详细的指出内存泄露的位置,同事注意不要strip,否则-g就白加了。
编译:
$make clean;make all
查看依赖库:
$ arm-linux-readelf –d ../bin/out/skyapp
0x00000001 (NEEDED) Shared library: [libasan.so.0]
0x00000001 (NEEDED) Shared library: [libgcc_s.so.1]
0x00000001 (NEEDED) Shared library: [libc.so.6]
将libasan.so.0拷贝到rootfs中
继续查看libasan.so.0的依赖:
$ arm-linux-readelf -d ./bin/out/libasan.so.0.0.0
0x00000001 (NEEDED) Shared library: [libpthread.so.0]
0x00000001 (NEEDED) Shared library: [libdl.so.2]
0x00000001 (NEEDED) Shared library: [libstdc++.so.6]
0x00000001 (NEEDED) Shared library: [libm.so.6]
0x00000001 (NEEDED) Shared library: [libc.so.6]
0x00000001 (NEEDED) Shared library: [ld-linux-armhf.so.3]
0x00000001 (NEEDED) Shared library: [libgcc_s.so.1]
0x0000000e (SONAME) Library soname: [libasan.so.0]
将所有的依赖库拷贝到rootfs的lib目录下。
烧入板子后,正常运行,会直接打印显示出问题程序的地方
==1356== ERROR: AddressSanitizer: global-buffer-overflow on address 0x0170da7f at pc 0x32e81 bp 0xb516dd08 sp 0xb516dd0c
READ of size 1 at 0x0170da7f thread T33
#0 0x32e7f (/home/skyapp/out/skyapp+0x32e7f)
#1 0x31d76f (/home/skyapp/out/skyapp+0x31d76f)
#2 0xb59b1f3f (/lib/libasan.so.0.0.0+0xdf3f)
0x0170da7f is located 45 bytes to the right of global variable 's_software_release_date (/home/drteam/huzhiming/work/BCM7251S/unimaincode_zenterio/code/src/skhdi/sk_hdi_factory_test/factory/src/sk_hdi_fct_window.c)' (0x170da20) of size 50
's_software_release_date (/home/drteam/huzhiming/work/BCM7251S/unimaincode_zenterio/code/src/skhdi/sk_hdi_factory_test/factory/src/sk_hdi_fct_window.c)' is ascii string ''
0x0170da7f is located 1 bytes to the left of global variable 's_uart_buffer (/home/drteam/huzhiming/work/BCM7251S/unimaincode_zenterio/code/src/skhdi/sk_hdi_factory_test/factory/src/sk_hdi_fct_window.c)' (0x170da80) of size 4500
's_uart_buffer (/home/drteam/huzhiming/work/BCM7251S/unimaincode_zenterio/code/src/skhdi/sk_hdi_factory_test/factory/src/sk_hdi_fct_window.c)' is ascii string ''
…
==1356== ABORTING
通过查看skyapp.map文件,查找pc 0x32e81在哪个函数中:
0x00032cc4 sk_hdi_fct_uart_task
可以看出出问题的是在函数sk_hdi_fct_uart_task中,那么到底是哪一行有问题呢
$ arm-linux-objdump -d ./bin/out/skyapp --start-address=0x00032cc4 --stop-address=0x00033230
32e72: 4001 ands r1, r0
32e74: b2c9 uxtb r1, r1
32e76: 2900 cmp r1, #0
32e78: d002 beq.n 32e80 <sk_hdi_fct_uart_task+0x1bc>
32e7a: 4618 mov r0, r3
32e7c: f7f1 ef94 blx 24da8 <_init+0xb50>
32e80: f64d 2380 movw r3, #55936 ; 0xda80
32e84: f2c0 1370 movt r3, #368 ; 0x170
32e88: 5c9b ldrb r3, [r3, r2]
32e8a: 2b0d cmp r3, #13
32e8c: d0ac beq.n 32de8 <sk_hdi_fct_uart_task+0x124>
32e8e: 6b3b ldr r3, [r7, #48] ; 0x30
32e90: 1e5a subs r2, r3, #1
32e92: f64d 2380 movw r3, #55936 ; 0xda80
32e96: f2c0 1370 movt r3, #368 ; 0x170
32e9a: 4413 add r3, r2
32e9c: 08d9 lsrs r1, r3, #3
32e9e: f101 5100 add.w r1, r1, #536870912 ; 0x20000000
找到对应的代码位置:
while (s_uart_buffer[ReadSize-1] == '\r' || s_uart_buffer[ReadSize-1] == '\n')
{
s_uart_buffer[--ReadSize] = 0;
}
可以找到全局变量越界了,修改后重新编译运行,未发现问题,拷机5小时仍然未发任何问题,编写测试小程序:
#include <stdlib.h>
void *p;
int main() {
p = malloc(7);
p = 0; // The memory is leaked here.
return 0;
}
$
arm-linux-gcc -g -fsanitize=address test.c –lstdc++
交叉编译,放入板子中运行
$ ASAN_OPTIONS=detect_leaks=1 ./a.out
发现认为检测到泄露,查找资料发现AddressSanitizerLeakSanitizer gcc4.8不一定支持,所以该方法行不通。
参考文档:
2.使用Valgrind
1. 交叉编译
tar xvf valgrind-3.9.0.tar.bz2
cd valgrind-3.9.0
apt-get install automake
./autogen.sh
修改configure
armv7*) 改成 armv7*|arm)
./configure --host=arm-linux CC=arm-linux-gcc --prefix=./valgrind
make
make install
2.编译要调试的程序:
需要给加上-g选项和-O0
CFLAGS += -g -O0
见valgrind的说明:
Compile your program with
-g
to include debugging information so that Memcheck's error messages include exact line numbers. Using
-O0
is also a good idea, if you can tolerate the slowdown. With
-O1
line numbers in error messages can be inaccurate, although generally speaking running Memcheck on code compiled at
-O1
works fairly well, and the speed improvement compared to running
-O0
is quite significant. Use of
-O2
and above is not recommended as Memcheck occasionally reports uninitialised-value errors which don't really exist
3.运行
$/home/drteam/huzhiming/valgrind/bin/valgrind --tool=memcheck --leak-check=full --show-leak-kinds=all ../out/skyapp
注意:--prefix=/opt/Valgrind指定的目录要与开发板上放置的目录一致,不然运行valgrind时可能会出现“valgrind: failed to start tool 'memcheck' for platform 'arm-linux': No such file or directory”错误。
或者使用
export VALGRIND_LIB="
/home/drteam/huzhiming/valgrind/
lib/valgrind"
运行得到如下结果:
valgrind: Fatal error at startup: a function redirection
valgrind: which is mandatory for this platform-tool combination
valgrind: cannot be set up. Details of the redirection are:
valgrind:
valgrind: A must-be-redirected function
valgrind: whose name matches the pattern: strcmp
valgrind: in an object with soname matching: ld-linux-armhf.so.3
valgrind: was not found whilst processing
valgrind: symbols from the object with soname: ld-linux-armhf.so.3
valgrind:
valgrind: Possible fixes: (1, short term): install glibc's debuginfo
valgrind: package on this machine. (2, longer term): ask the packagers
valgrind: for your Linux distribution to please in future ship a non-
valgrind: stripped ld.so (or whatever the dynamic linker .so is called)
valgrind: that exports the above-named function using the standard
valgrind: calling conventions for this platform. The package you need
valgrind: to install for fix (1) is called
valgrind:
valgrind: On Debian, Ubuntu: libc6-dbg
valgrind: On SuSE, openSuSE, Fedora, RHEL: glibc-debuginfo
valgrind:
valgrind: Note that if you are debugging a 32 bit process on a
valgrind: 64 bit system, you will need a corresponding 32 bit debuginfo
valgrind: package (e.g. libc6-dbg:i386).
valgrind:
valgrind: Cannot continue -- exiting now. Sorry.
查阅valgrind说明文档:
Valgrind indicates it cannot work because it is missing the libc debug info, and it indicates which package has to be installed to solve that. In your case (Ubuntu), you must install libc6-dbg
或者编译的libc加上-g选项
于是重新编译uclibc,加上-g选项,并且不要strip编译出来的库文件。
重现运行结果正常。
4.产生报告
因为memcheck只有在程序退出时才能报告内存泄露的情况,对于不会退出的程序该如何统计内存泄露情况呢?
If the signal causes the process to terinate then valgrind's normal exit handlers will run and (for example) report any leaks.
The only exception would be for kill -9 as in that case the process is killed by the kernel without ever being informed of the signal so valgrind has no opportunity to do anything.
Effectively, kill -9 does not allow valgrind to produce a report, as signal 9 cannot be handled by a process. Any other signal that will terminate your program will be properly handled by Valgrind, and lead to e.g. a correct leak report for memcheck tool.
$kill -TERM PID
得到的报告如下:
==1337== LEAK SUMMARY:
==1337== definitely lost: 0 bytes in 0 blocks
==1337== indirectly lost: 0 bytes in 0 blocks
==1337== possibly lost: 4,608 bytes in 32 blocks
==1337== still reachable: 1,909,366 bytes in 2,249 blocks
==1337== suppressed: 0 bytes in 0 blocks
==1337==
==1337== For counts of detected and suppressed errors, rerun with: -v
==1337== Use --track-origins=yes to see where uninitialised values come from
==1337== ERROR SUMMARY: 1038118 errors from 78 contexts (suppressed: 0 from 0)
从这个报告得不到任何有用的信息,definitely lost和indirectly lost都为0,possibly lost和still reachable也不是很大,并且随着拷机时间的长度,这两个值变化不大,也就是没有泄露了,suppressed是抑制的lost,选项-v可以查看当前使用的抑制文件:
valgrind -v --tool=memcheck ls –l
这里使用了默认的$PREFIX/lib/valgrind/default.supp,当然了可以使用--default-suppressions=no选项关闭默认抑制文件,但是这里为0,显然也不是抑制lost
但是
ERROR SUMMARY: 1038118 errors from 78 contexts (suppressed: 0 from 0)为何会如此之高,并且随着运行时间的增加而增加,那么ERROR是怎么来的呢?
我们来看看valgrind关于ERROR的解释:
Because there are different kinds of leaks with different severities, an interesting question is: which leaks should be counted as true "errors" and which should not?
The answer to this question affects the numbers printed in the ERROR SUMMARY line, and also the effect of the --error-exitcode option. First, a leak is only counted as a true "error" if --leak-check=full is specified. Then, the option --errors-for-leak-kinds=<set> controls the set of leak kinds to consider as errors. The default value is --errors-for-leak-kinds=definite,possible
默认情况下只有definite,possible被认为是错误,当然可以通过--errors-for-leak-kinds=<set>选项来设置,当使用了--leak-check=full选项时,所有的leak都认为是错误。
但是问题是definitely,indirectly,possibly,still reachable,suppressed加起来几乎是不变的,而这里ERROR SUMMARY却在不断的增长,显然1038118 errors不是由leak引起的而是其他的错误,但是程序明明是有内存泄露的,为何valgrind检测不出来呢,搞不清楚。
参考手册:
3.使用mtrace
在需要内存泄漏检查的代码的开始调用void mtrace(void) (在mcheck.h中有声明). mtrace为malloc等函数安装hook, 用于记录内存分配信息. 在需要内存泄漏检查的代码的结束调用void muntrace(void).
注意: 一般情况下不要调用muntrace, 而让程序自然结束. 因为可能有些释放内存代码要到muntrace之后才运行.
The mtrace() function installs hook functions for the memory-
allocation functions (malloc(3), realloc(3) memalign(3), free(3)).
These hook functions record tracing information about memory
allocation and deallocation. The tracing information can be used to
discover memory leaks and attempts to free nonallocated memory in a
program.
The muntrace() function disables the hook functions installed by
mtrace(), so that tracing information is no longer recorded for the
memory-allocation functions. If no hook functions were successfully
installed by mtrace(), muntrace() does nothing.
When mtrace() is called, it checks the value of the environment
variable MALLOC_TRACE, which should contain the pathname of a file in
which the tracing information is to be recorded. If the pathname is
successfully opened, it is truncated to zero length.
If MALLOC_TRACE is not set, or the pathname it specifies is invalid
or not writable, then no hook functions are installed, and mtrace()
has no effect. In set-user-ID and set-group-ID programs,
MALLOC_TRACE is ignored, and mtrace() has no effect.
调试方法如下:
vi a.c
[cpp] view plain copy
1 #include <mcheck.h>
2
3 int main()
4 {
5 mtrace();
6 malloc(10);
7 malloc(16);
8 return 0;
9 }
$gcc -g a.c #记得编译带-g调试选项
$export MALLOC_TRACE=a.log
$./a.out
$unset MALLOC_TRACE #记得执行完后unset变量,否则可能运行其他命令可能覆盖log
$mtrace a.out a.log
Memory not freed:
-----------------
Address Size Caller
0x09b08378 0xa at /XXX/a.c:6
0x09b08388 0x10 at /XXX/a.c:7
可以看到,会显示未释放动态空间的代码具体位置.
使用限制:
仅仅适用于使用GNU libc的程序,也即是libc中实现了mtrace()和muntrace()函数。
我们这里使用的uclibc,显然该方法不适合。
参考文档:
4.使用memwatch
实现原理为,重新实现malloc和free函数,链接时替换掉系统的malloc和free的实现。
memwatch根本是不需要安装的,因为它只是一组C程序代码,只要在你程序中加入memwatch.h,编译时加上-DMEMWATCH -DMW_STDIO及memwatch.c就能使用memwatch,例如:
gcc -DMEMWATCH -DMW_STDIO test.c memwatch.c -o test
memwatch 的输出文件名称为memwatch.log,而且在程序执行期间,所有错误提示都会显示在stdout上,如果memwatch未能写入以上文件,它会尝 试写入memwatchNN.log,而NN介于01至99之间,若它仍未能写入memwatchNN.log,则会放弃写入文件。
Memwatch 的优点是无需特別配置,不需安装便能使用,但缺点是它会拖慢程序的运行速度,尤其是释放内存时它会作大量检查。但它比mtrace和dmalloc多了 一项功能,就是能模拟系统内存不足的情況,使用者只需用mwLimit(long num_of_byte)函数来限制程式的heap memory大小(以byte单位)。
缺点是需要修改调试程序源码,并且需要在每个c文件中包含memwatch.h
#define malloc(n) mwMalloc(n,__FILE__,__LINE__)
#define free(p) mwFree(p,__FILE__,__LINE__)
这里c文件太多,修改不方便,放弃。
5.使用dmalloc
:
dmalloc是一个简单易用的C/C++内存leak检查工具,以一个运行库的方式发布。dmalloc能够检查出直到程序运行结束还没有释放的内存,并且能够精确指出在哪个源文件的第几行。
Dmalloc的局限性:
1. Dmalloc只能检测堆上内存,对栈内存和静态内存无能为力。
2. dmalloc只用于利用malloc申请的内存,对使用sbrk()或mmap()分配的内存无能为力。
3. dmalloc不能用于检测读写没有申请的或者没有初始化的内存,也不能检测写只读内存。
使用方法:
1.编译dmalloc库
从网上下载dmalloc源码,使用交叉编译环境执行configure,编译线程可重入版本的静态库。编译完成后会在当前目录下生成libdmallocth.a静态库,
libdmallocth.a是C版本静态库,如果要编译支持C++版本的静态库使用make threadscxx。
CC=arm-linux-gcc ./configure --host=arm-linux --enable-threads
checking for getpagesize... yes
checking basic-block size... configure: error: cannot run test program while cross compiling
See `config.log' for more details.
修改configure文件
echo "$as_me:$LINENO: checking basic-block size" >&5
echo $ECHO_N "checking basic-block size... $ECHO_C" >&6
ac_cv_page_size=0改为12
检查return.h中GET_RET_ADDR宏是否在arm上实现正确。
关于dmalloc库的编译安装可以查看官方文档:
2.修改调试的程序
(非必要)修改每个C文件
/* other includes above ^^^ */
#ifdef DMALLOC
#include "dmalloc.h"
#endif
一定要加在最下面,这样在打印泄露报告时就会详细报告泄露地方的所在文件和行号,如果不修改的会报告中的ra就是调用malloc函数的地址,修改每个c文件太麻烦,不用修改。
在调试程序中周期性的调用如下:
dmalloc_log_stats();
dmalloc_log_unfreed();
当然也可以统计某个时间段内未释放的情况:
mark = dmalloc_mark(); //开始标记
//some time ....
dmalloc_log_changed(mark, 1, 0, 1); //从标记到现在未释放的内存
可以将该代码放入信号处理函数中,在程序运行过程中给它发送信号来动态的监控某段时间内内存未释放的情况。
3.编译调试程序
将要调试的程序代码与libdmallocth.a静态库一起编译,生成我们需要的调试版本程序,这里一定要注意libdmallocth.a放在编译依赖的最后面,因为后面的将覆盖前面的,dmalloc的实现原理主要是在编译时使得应用程序的内存操作(如malloc)调用dmalloc库中的malloc接口,然后dmalloc的malloc函数调用系统的brk进行内存申请,从而使用dmalloc库接管的应用程序的内存操作而可以进行统计分析,详见dmalloc的源码。
在src/main/makefile中增加:SK_LIBS_NAME +=dmallocth
将dmalloc.h头文件拷贝到include目录
将libdmallocth.a拷贝到lib目录。
make clean;make all
4.运行
可以直接手动设置环境变量:
DMALLOC_OPTIONS="debug=0x4000503,log=/var/bcm_dmalloc.log"
export DMALLOC_OPTIONS
也可以不设置环境变量,直接调用dmalloc的接口函数来设置相关参数
dmalloc_debug_setup("debug=0x4000503,log=/var/bcm_dmalloc.log ");
或者借助dmalloc工具程序设置环境变量,它的工作原理是生成不同类型shell设置环境变量的命令
set_variable()函数输出要执行的命令,然后调用shell命令执行输出
function dmalloc { eval `command dmalloc -b $*`; }
本质上等价于:
$ dmalloc -b arguments … > /tmp/out
$ . /tmp/out
具体细节可以查看:
支持的环境变量包括:
Debug
Log
具体细节可以查看:
debug选项传入的值存放在_dmalloc_flags变量中,该值影响程序的行为:
/* report on non-freed pointers */
if (BIT_IS_SET(_dmalloc_flags, DEBUG_LOG_NONFREE)) {
_dmalloc_chunk_log_changed(0, 1, 0,0)
5.报告
可以得到报告:
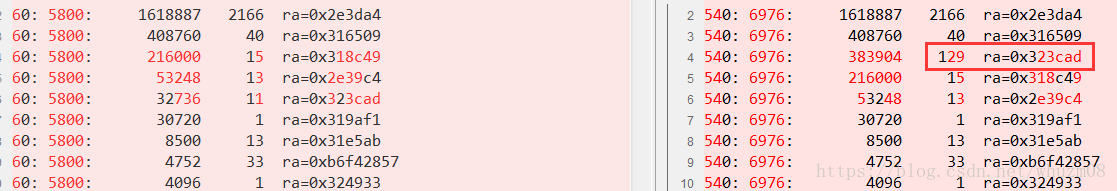
可以看到泄露的位置:0x323cad,通过查看skyapp.map文件:

可以得到该地址位于sk_hdi_test_read_drm_key_from_file函数中,查找该函数中的调用malloc的位置就能找到泄露的位置,当然还有更简单的方法,当通过确定了ra位于哪个文件后,在该文件中包含dmalloc.h文件,重新编译运行,这样得到的报告就能确切的指出发生泄漏的哪一行。
read_buffer = malloc(file_size);
read_buffer为临时变量,该函数没有free后直接返回了。
修改后,重新拷机测试,未发现泄露,问题解决。
参考文档: