之前在开发中经常使用var_dump 和 die 进行调式
所以就研究了一下 phpstrom 的断点调式
- 使用前提条件
- 开启 php Xdebug 扩展
- 在 php.ini 加上如下配置 (为了演示方便开发环境使用的是 wamp)
[xdebug]
zend_extension="c:/wamp64/bin/php/php7.2.4/zend_ext/php_xdebug-2.6.0-7.2-vc15-x86_64.dll"

xdebug.remote_enable = on
xdebug.auto_trace = On
xdebug.remote_handler = dbgp
xdebug.remote_host = localhost
xdebug.remote_port = 9000
xdebug.idekey = PHPSTORM
xdebug.profiler_enable = off
xdebug.profiler_enable_trigger = Off
xdebug.profiler_output_name = cachegrind.out.%t.%p
xdebug.profiler_output_dir ="c:/wamp64/tmp"
xdebug.show_local_vars=0- 配置 phpstrom
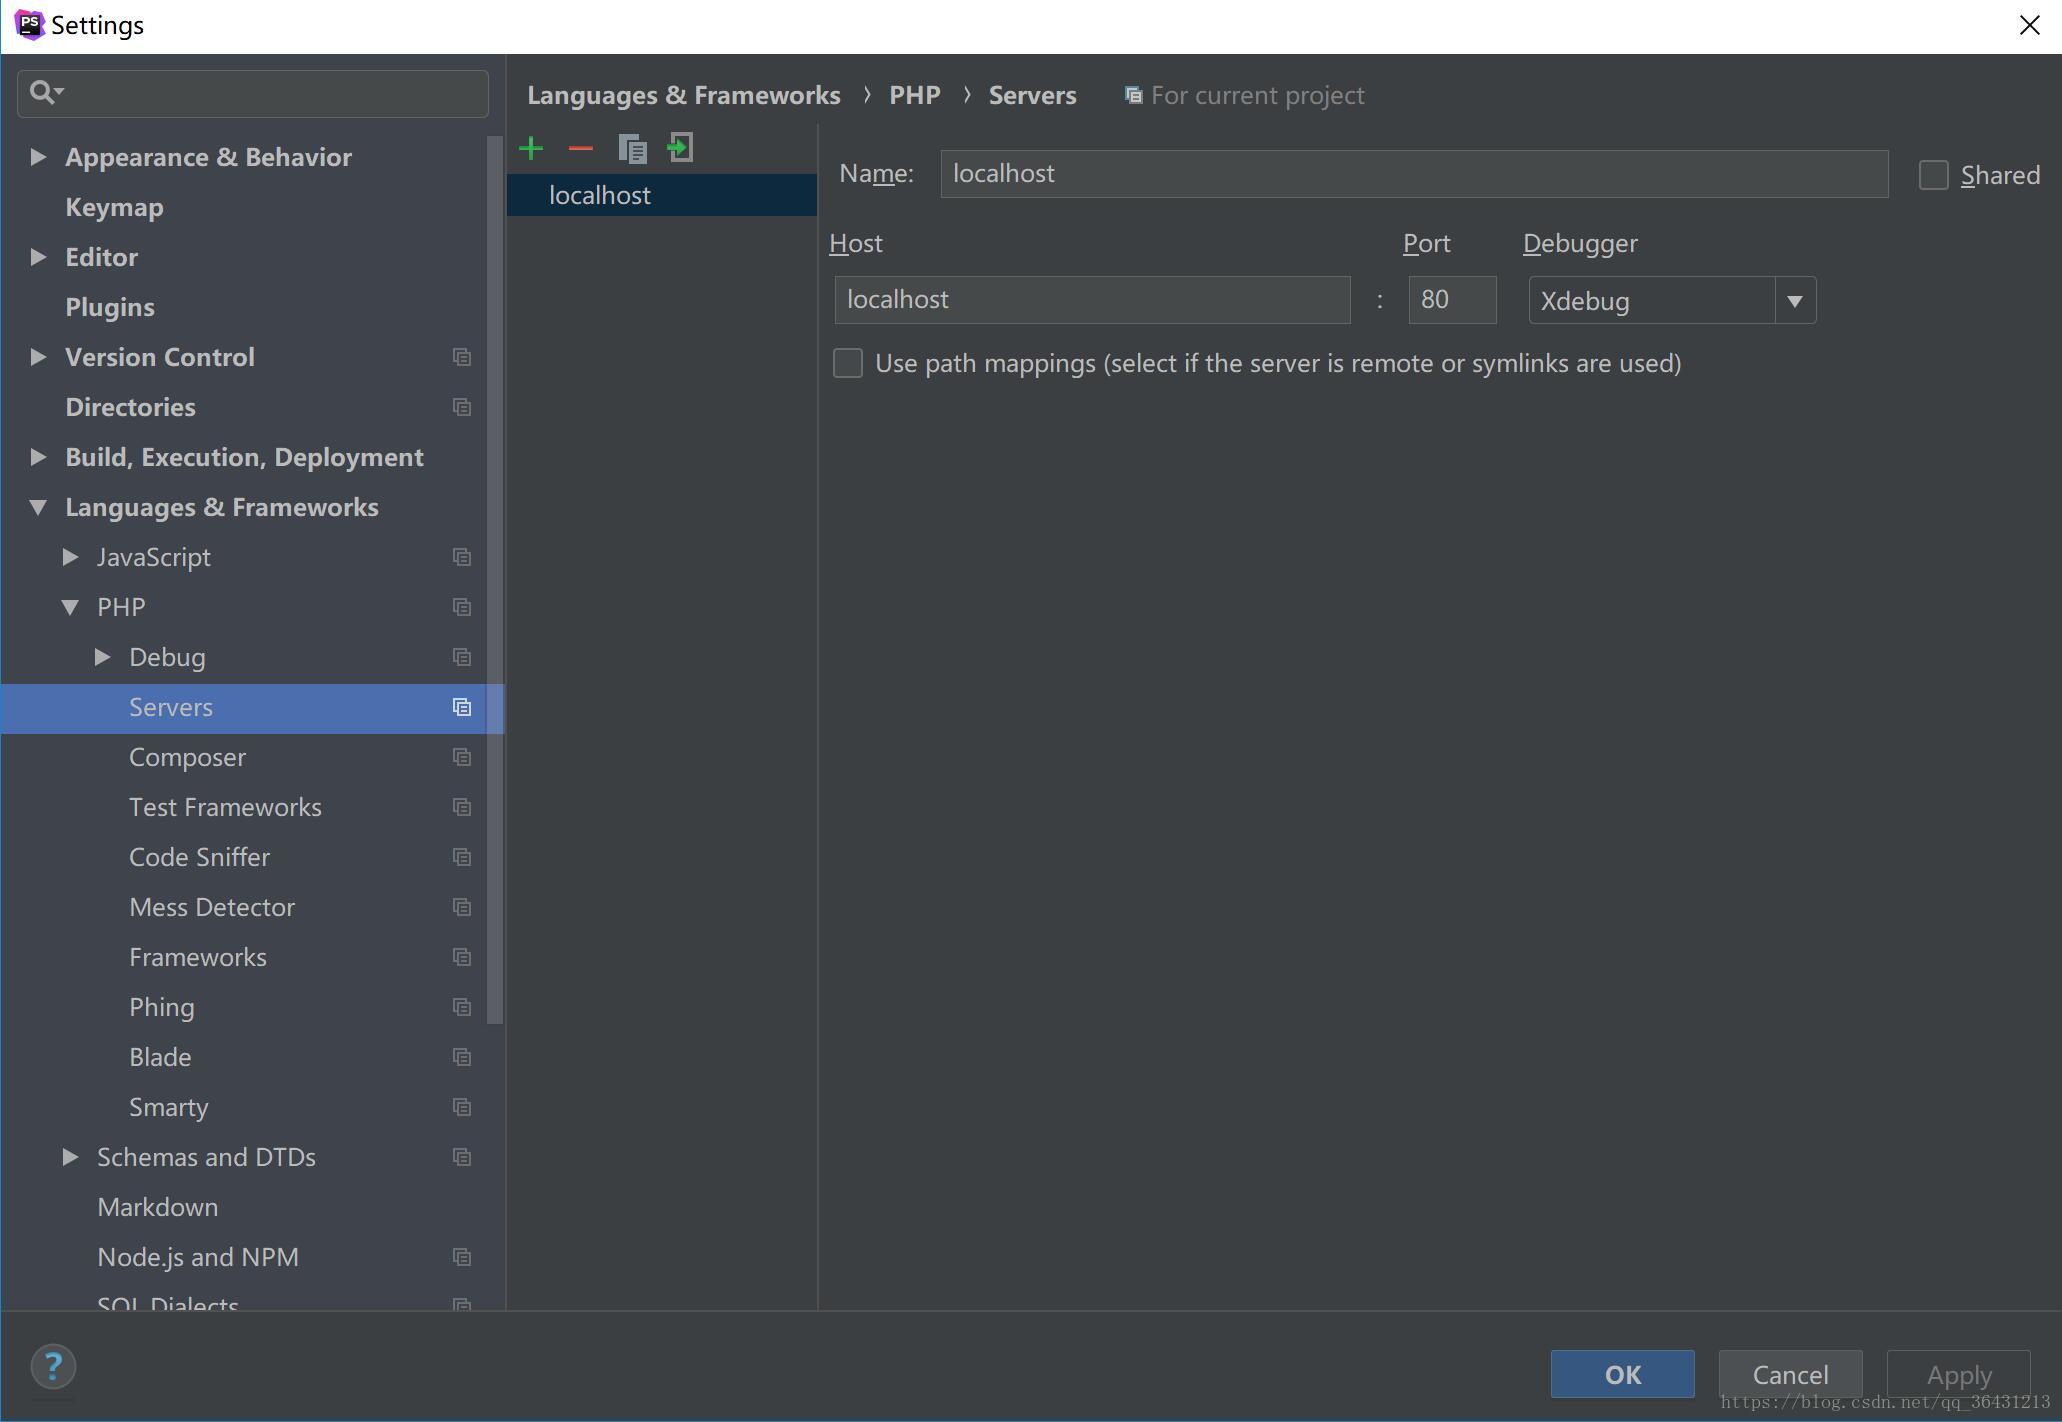
- 配置
File | Settings | Languages & Frameworks | PHP | Servers
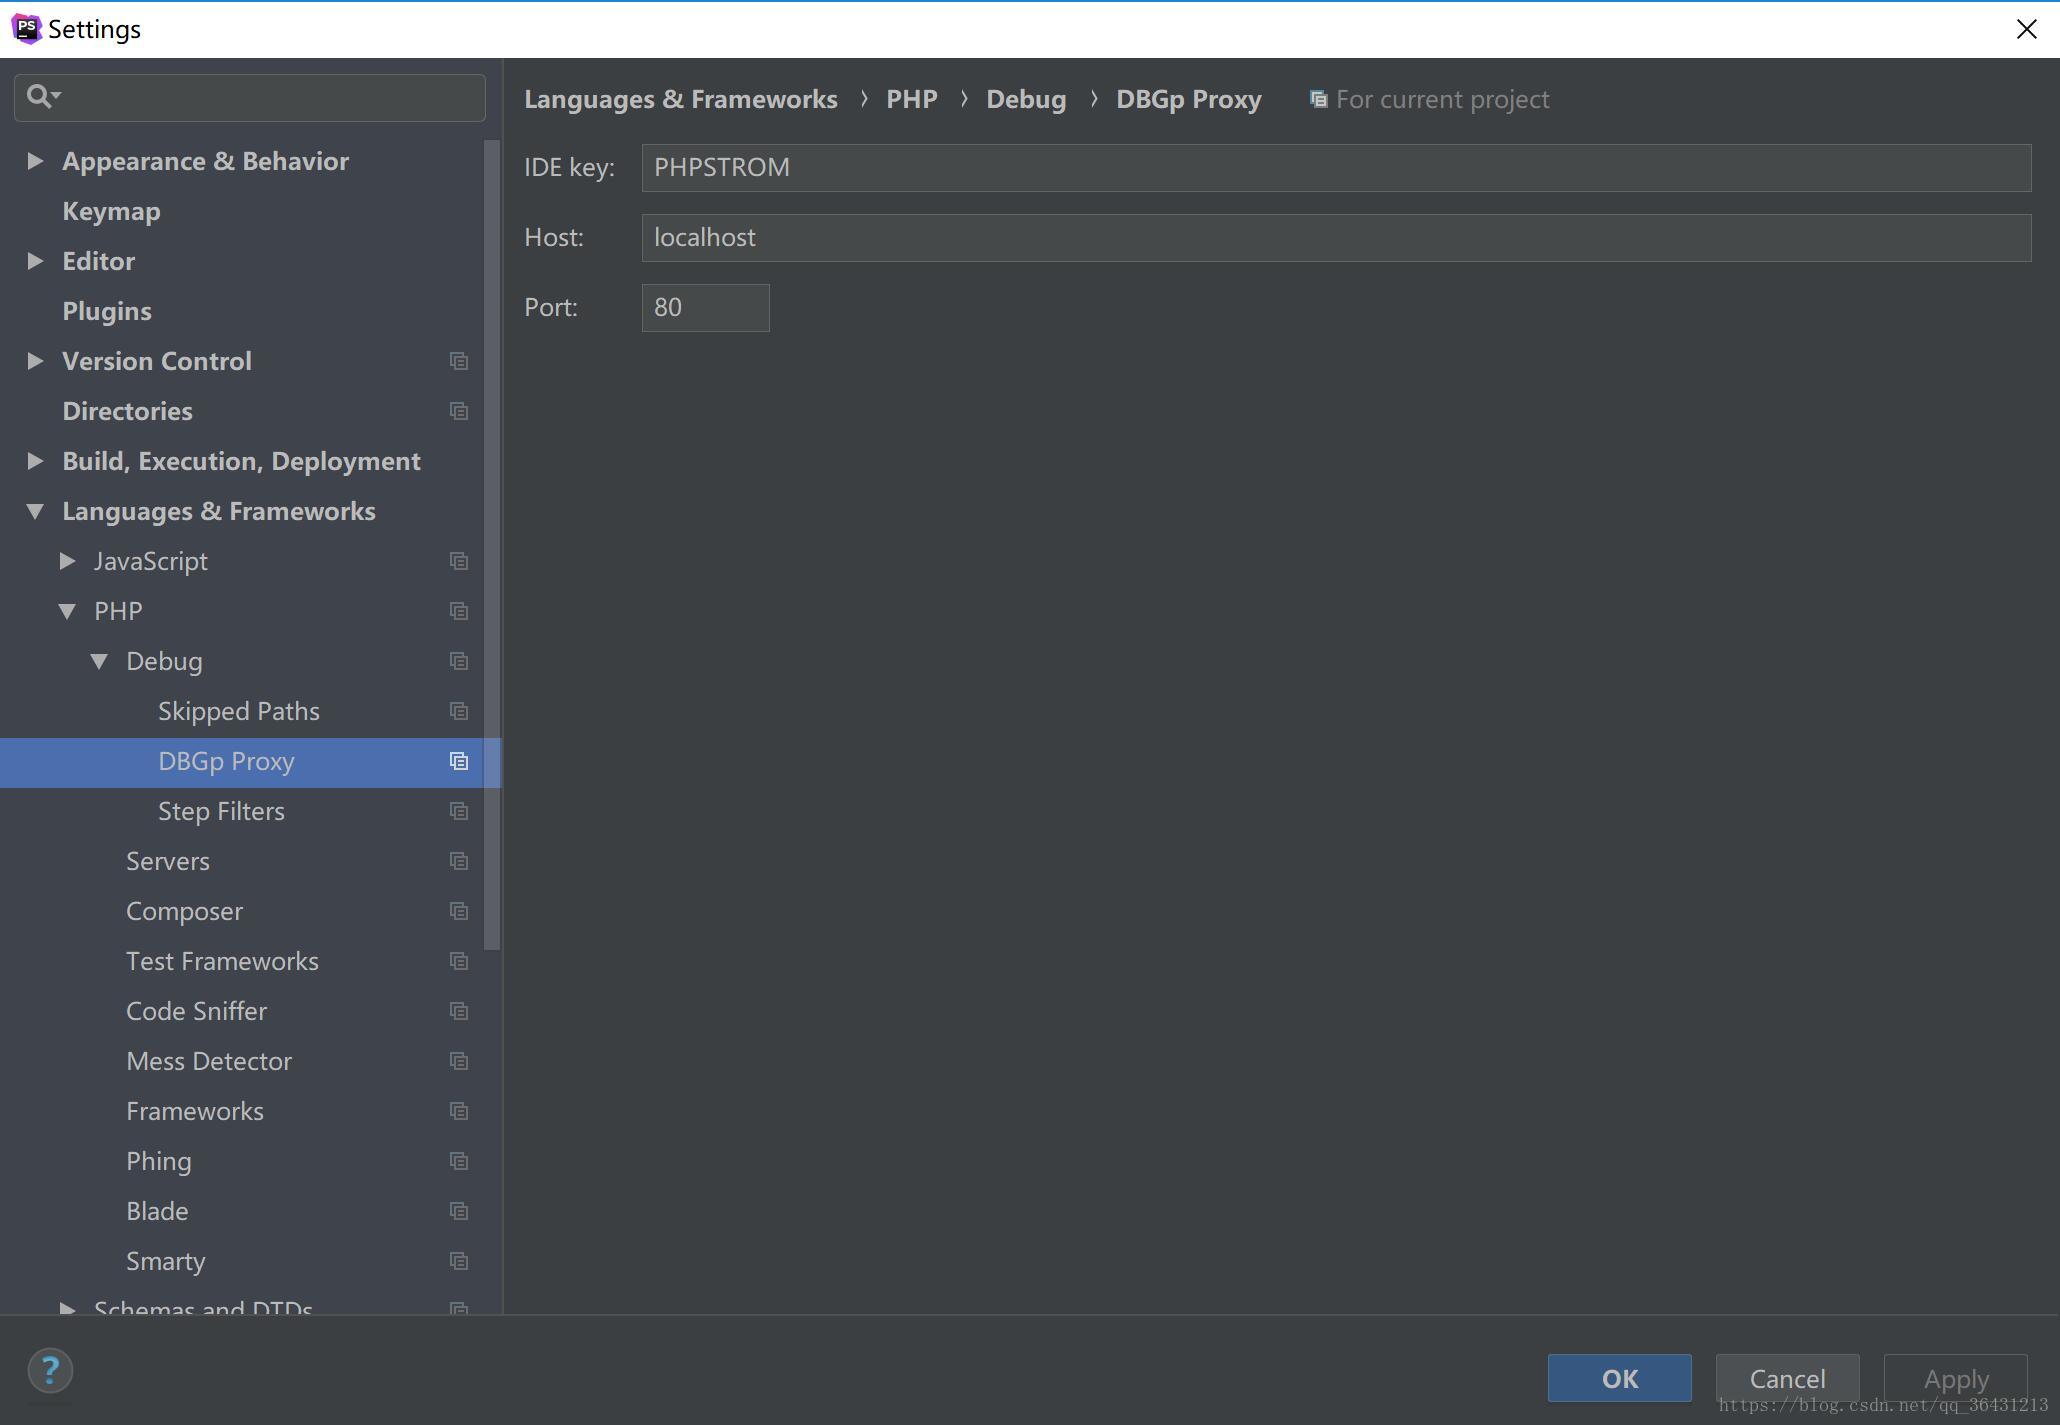
- 配置
File | Settings | Languages & Frameworks | PHP | Debug | DBGp Proxy
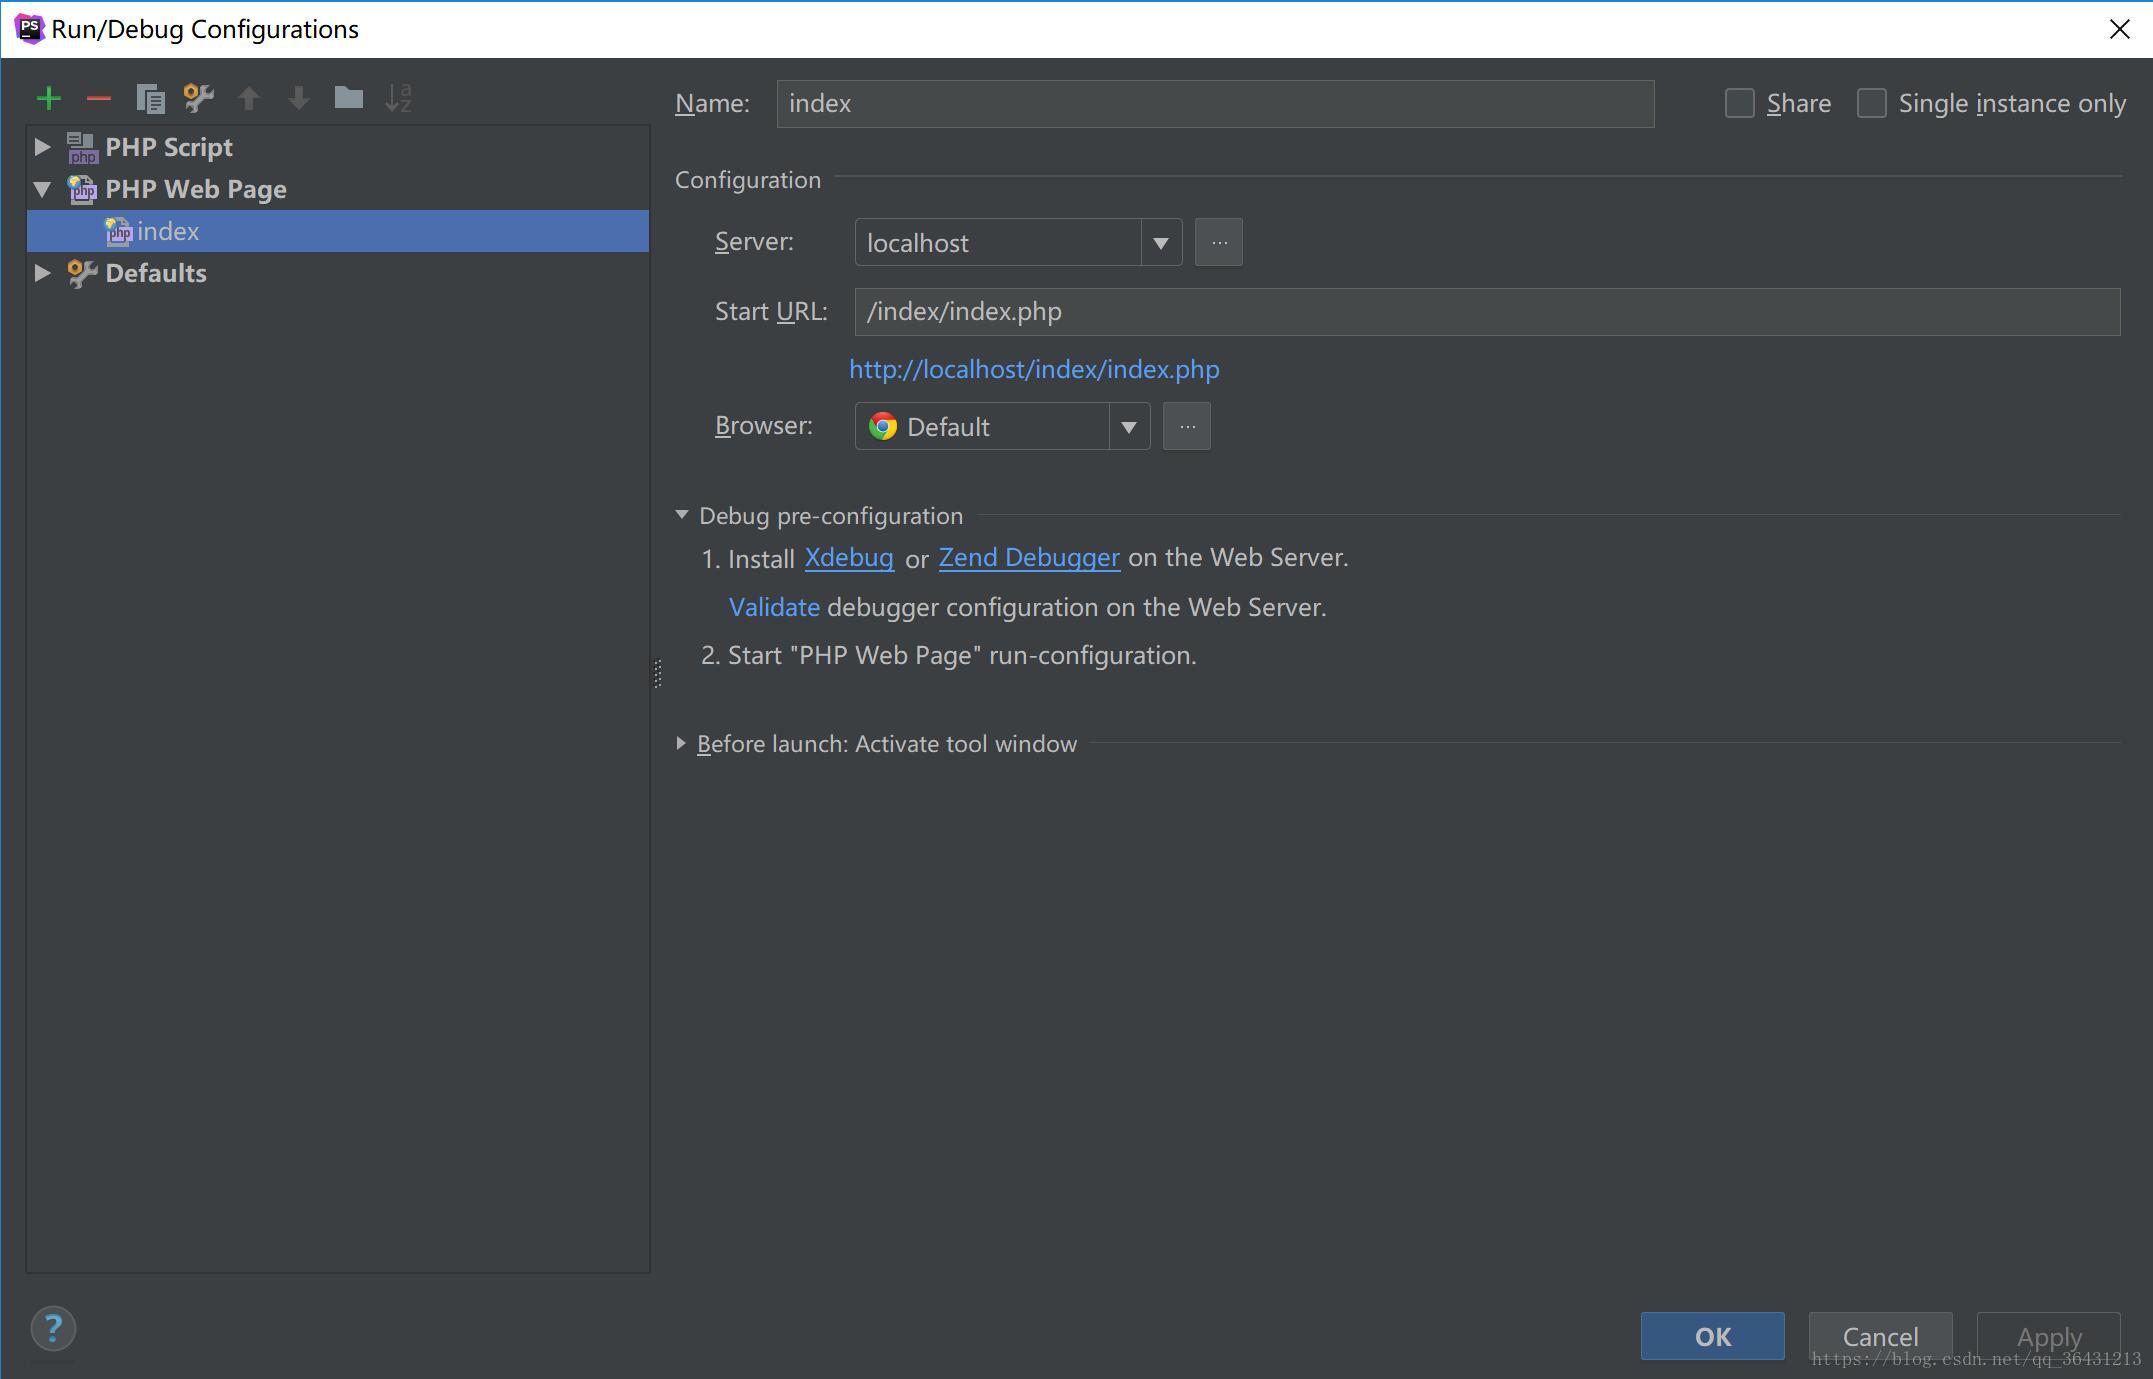
- 配置
|Run|Debug Configurations
- web 项目使用
PHP Web Page
- 普通项目直接使用
PHP Script即可
- web 项目使用
- 配置
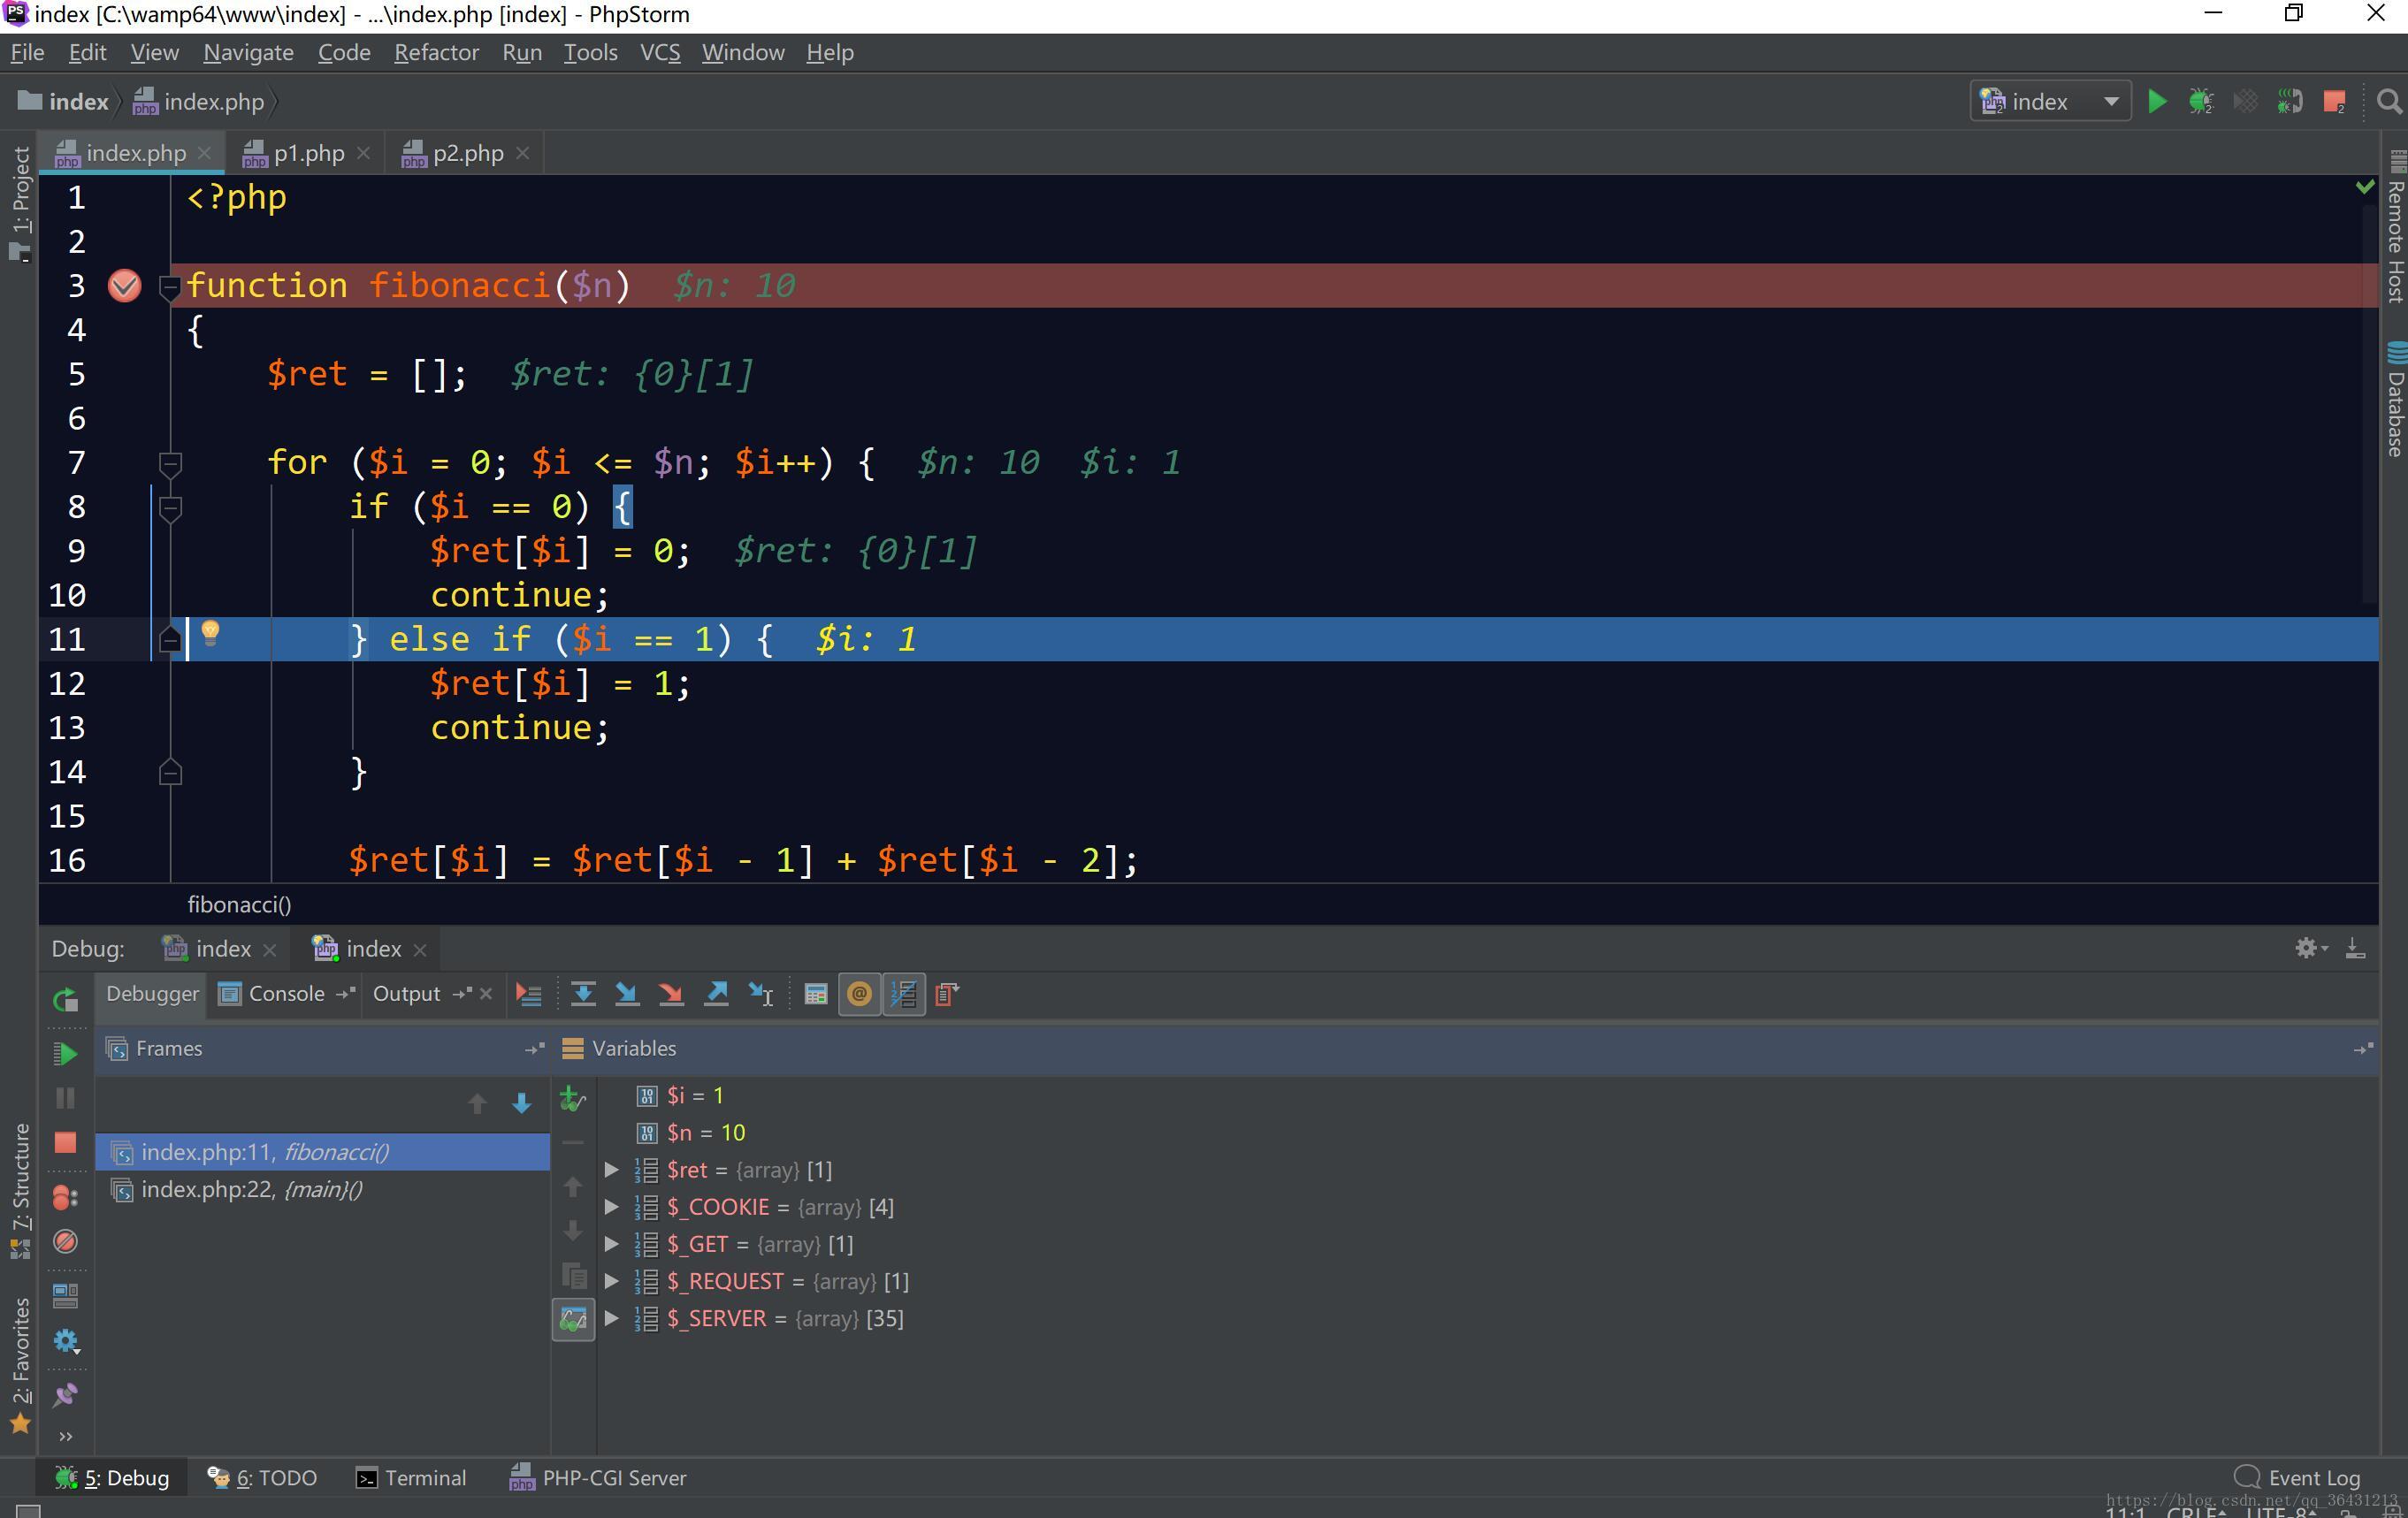
开始 断点调式 (点击 phpstrom 右上方绿色小虫子图标即可开始)
- 在 debug 栏 点击 红色向下 的箭头 可强制进入函数进行断点调式 如何代码就会一步步执行
- 在 debug 栏 点击 红色向下 的箭头 可强制进入函数进行断点调式 如何代码就会一步步执行