在小马哥课堂-统计学-中心极限定理一节的例子中提到一个标准误差的概念,有同学对此不清楚,所以这里单独写一节,来对standard error进行阐述,希望能大家能有一个直观的理解。
Standard error(标准误差)
The standard error (SE) of a statistic (usually an estimate of a parameter) is the standard deviation of its sampling distribution.If the parameter or the statistic is the mean, it is called the standard error of the mean (SEM).
The sampling distribution of a population mean is generated by repeated sampling and recording of the means obtained. This forms a distribution of different means, and this distribution has its own mean and variance. Mathematically, the variance of the sampling distribution obtained is equal to the variance of the population divided by the sample size. This is because as the sample size increases, sample means cluster more closely around the population mean.
Therefore, the relationship between the standard error and the standard deviation is such that, for a given sample size, the standard error equals the standard deviation divided by the square root of the sample size. In other words, the standard error of the mean is a measure of the dispersion of sample means around the population mean.
标准误差,通常是指 某个统计量(一般是某个分布的参数估计,例如正态分布的\(\mu\)参数的估计)的标准误差,即抽样分布的标准差。
对总体进行样本容量为n的抽样,样本容量为n,反复进行抽样,那么"每个样本"的均值 形成一个分布,该分布有自己的期望和方差。数学上,抽样分布的方差等于 总体方差除以样本容量。随着样本容量的增大,样本均值越来越接近于总体均值。因此,标准差和标准误的关系是:给定样本容量n,标准误等于 标准差除以 样本容量的平方根。换而言之,样本均值的标准误是衡量 样本均值和总体均值的离散程度。
我们知道,方差是衡量 随机变量与其期望的离散程度;
又因为,样本均值的标准误是衡量 样本均值和总体均值的离散程度;
所以,我们将 样本均值 看成是一个 随机变量\(\overline X\),那么,标准误就是 随机变量\(\overline X\)的标准差。概括言之(抽象成更一般的情况),标准误是抽样分布的标准差。
Population
The standard error of the mean (SEM) can be expressed as:
\[\sigma_\bar x = \frac {\sigma}{\sqrt n}\]

where
σ is the standard deviation of the population.
n is the size (number of observations) of the sample.
Estimate
Since the population standard deviation is seldom known, the standard error of the mean is usually estimated as the sample standard deviation divided by the square root of the sample size (assuming statistical independence of the values in the sample).
\[\sigma_\bar x \approx \frac {s}{\sqrt n}\]
where
s is the sample standard deviation (i.e., the sample-based estimate of the standard deviation of the population), and
n is the size (number of observations) of the sample.
代码示例
#!/usr/bin/env python3
#-*- coding:utf-8 -*-
#############################################
#File Name: standard_error.py
#Brief:  直观上演示 标准误差公式 的正确性
#Author: frank
#Email: [email protected]
#Created Time:2018-08-09 20:29:10
#Blog: http://www.cnblogs.com/black-mamba
#Github: https://github.com/xiaomagejunfu0903
#############################################
import random
import matplotlib.pyplot as plt
import numpy as np

n=10000

#list_population=list(np.random.normal(size=n))
list_population = list(np.random.randint(low=1,high=7,size=n))
#print("list_population:{},len:{}".format(list_population,len(list_population)))

#总体期望
mean_population=np.mean(list_population)
print("mean_population: %.6f"%mean_population)

#总体标准差
sigma=np.std(list_population,ddof=0)
print("standard deviation of population:{}".format(sigma))

#显示总体分布
plt.figure(1)
n,bins,patches = plt.hist(list_population,bins='auto',density=1)
y_population = ((1 / (np.sqrt(2 * np.pi) * sigma)) * np.exp(-0.5 * (1 / sigma * (bins - mean_population))**2))
plt.plot(bins, y_population, 'r--')
plt.title('population distribution')
text_comment = "$\mu={},\ \sigma={}$".format(mean_population,sigma)
plt.text(1, .5, text_comment,{'color':'r','fontsize':15})

#抽样分布
#获取standard error of the mean
def get_SEM(list_population, simple_size, sampling_times):
    #进行 容量为simple_size的样本 抽样,抽样次数为sampling_times
    for i in range(sampling_times):
        samples=random.sample(list_population,simple_size)
        #print("samples:{}".format(samples))
        sampling_mean = np.mean(samples)
        #print("sampling mean:{}".format(sampling_mean))
        list_sampling_mean.append(sampling_mean)
    print("size of list_sampling_mean:{}".format(len(list_sampling_mean)))
    sampling_sd = np.std(list_sampling_mean,ddof=0)
    print("standard deviation of the sampling mean:{}".format(sampling_sd))
    return sampling_sd

#样本容量
simple_size = 10
#抽样次数
sampling_times = 1000
#样本均值list
list_sampling_mean = []

print("理论标准误:{}".format(sigma/np.sqrt(simple_size)))

sampling_sd = get_SEM(list_population, simple_size, sampling_times)

plt.figure(2)
n,bins,patches = plt.hist(list_sampling_mean,bins='auto',density=1)
y_population = ((1 / (np.sqrt(2 * np.pi) * sampling_sd)) * np.exp(-0.5 * (1 / sampling_sd * (bins - np.mean(list_sampling_mean)))**2))
plt.plot(bins, y_population, 'r--')
plt.title('sample distribution of the sample mean')
text_comment = "real $\mu={0:},\ \sigma={1:}$".format(np.mean(list_sampling_mean),sampling_sd)
plt.text(2.0, 0.4, text_comment,{'color':'r','fontsize':15})
text_comment = "theoretical standard error of the mean:{}".format(sigma/np.sqrt(simple_size))
plt.text(2.0, 0.8, text_comment,{'color':'m','fontsize':15})

plt.show()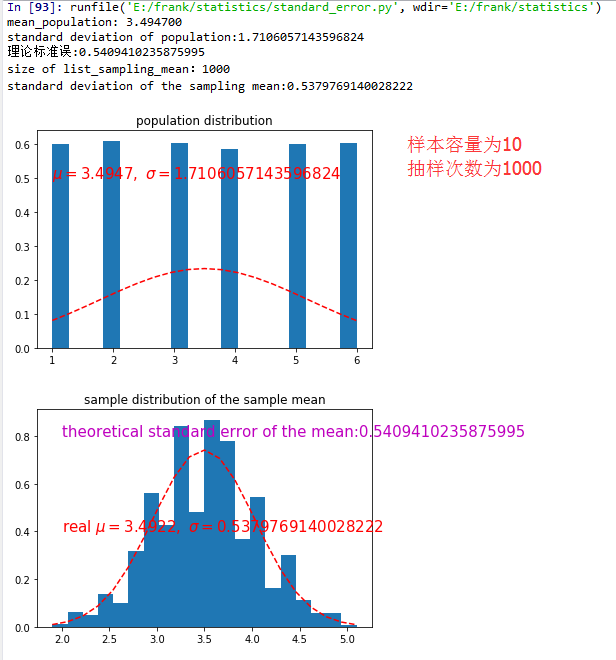
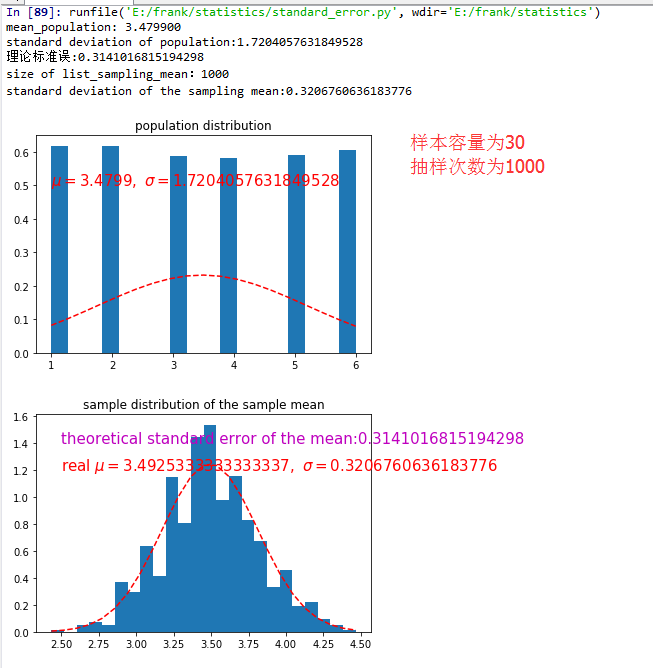
从上面的结果可以看出,抽样分布的方差等于 总体方差除以样本容量,而且随着样本容量和抽样次数的增加,标准误的之越来越小,即越接近总体方差。