一、matlab允许用户在同一图形窗口中同时绘制多张相互独立的子图
subplot(m,n,k):指令生成的图窗中有(m*n)张子图。k是子图的编号,编号顺序为:先从左到右,再从上到下;

>> x=0:0.1:8*pi;
>> y1=sin(x);
>> y2=2sin(x/2);
 y2=2sin(x/2);
    |
Error: Unexpected MATLAB expression.

>> y2=2*sin(x/2);
>> y3=3*sin(x/3);
>> subplot(x,y1,y2,y3)
Operands to the || and && operators must be convertible to logical scalar values.

Error in subplot (line 217)
                    if ~ishghandle(h, 'axes') || ...

>>  subplot(x,y1,x,y2,x,y3)
Operands to the || and && operators must be convertible to logical scalar values.

Error in subplot (line 217)
                    if ~ishghandle(h, 'axes') || ...

>> subplot(1,3,1)
>> y4=4*sin(x/4);
>> subplot(2,2,1)
>> plot(x,y1,'r--')
>> subplot(x,y2,'g-')
Error using  *
Inner matrix dimensions must agree.

Error in subplot (line 307)
                elseif max(plotId) > nCols * nRows

>> subplot(222)
>> subplot(x,y2,'g-')
Error using  *
Inner matrix dimensions must agree.

Error in subplot (line 307)
                elseif max(plotId) > nCols * nRows

>> subplot(x,y2,'g')
Error using  *
Inner matrix dimensions must agree.

Error in subplot (line 307)
                elseif max(plotId) > nCols * nRows

>> subplot(2,2,2)
>> subplot(x,y2,'g')
Error using  *
Inner matrix dimensions must agree.

Error in subplot (line 307)
                elseif max(plotId) > nCols * nRows

>> plot(x,y2,'g')
>> subplot(2,2,3)
>> plot(x,y3)
>> subplot(224)
>> plot(x,y4)
subplot(‘position’,[left botton width height]):该指令所产生的子图的位置有用户指定,指定位置的4个元素采用归一化标称单位(占屏幕的百分比),即认为图形窗的宽和高度的取值范围均为[0,1],左下角的坐标为(0,0)
subplot指令产生子图与其他图相互独立,使用subplot指令后,若绘制充满整个屏幕的图形,则需要用clf指令,清屏!!!!
二、matlab设置了鼠标操作的图形操作指令,分别是ginput,gtext,和zoom函数,ginput只能适用于二维图形,其他的适用于二维和三维。
ginput指令:

[x,y]=ginput(n):其功能为鼠标从二维图像中获得n个坐标(x,y)

>> [x,y]=ginput(4)

x =

    9.3351
   19.2287
   23.8564
   13.3245


y =

    2.8842
   -4.0211
   -1.2000
    0.8316
gtext(text):其功能为鼠标把字符串或者字符串元素数组放置到图形中作为文字说明。
使用gtext指令时需要注意:运行指令后会将当前的图像从后台调度到前台,同时,鼠标光标变为十字形,用户可以移动鼠标,将其定位于待放置的位置处点击鼠标,字符串将会被放置在紧靠十字中心点的第一象限位置上。
注意:若输入text是单个字符串,单击则可以一次性将所有字符以单行形式放置在图形中;如果text中包含多行字符串,则每次单击可将其中一行字符串放置在图形之中,直至放完。
t =

    'qewrqw'
    '3214d'
    'fdgdf'

>> gtext(t)
zoom指令:
zoom xon :规定当前图像的x轴可以进行缩放
zoom yon:
zoom on/off :规定当前图形的可以/不可以缩放
zoom:当前图形是否可以缩放状态的切换
zoom out:是图形返回初始状态
zoom (factory):设置缩放因子,默认为2
三、双坐标轴
plotyy(x1,y1,x2,y2):
plotyy(x1,y1,x2,y2,Fun):
plotyy(x1,y1,x2,y2,Fun1,Fun2):以左右不同的纵轴分别以Fun1,fun2指定的形式绘制x1-y1和x2-y2两条曲线
plotyy指令左侧纵用来描述x1-y1,而右侧纵轴是用来描述x2-y2,轴的范围与刻度都是自动生成的。
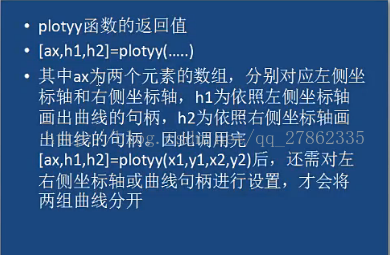
>> [ax,h1,h2]=plotyy(x,y1,x,y2);
>> %设置第一条曲线的y轴
>> set(get(ax(1),'Ylabel'),'string','leftY');
>> set(get(ax(2),'Ylabel'),'string','rightY');
>> %设置第一条线的属性
>> set(h1,'LineStyle',':','LineWidth',3);
>> set(h2,'LineStyle','*','LineWidth',3);
Warning: Setting marker type based on 'LineStyle' property
""         'Marker' and 'LineStyle' have been made separate properties
""         Use 'Marker' property to remove this warning
>>
四、fplot指令

(1)fplot(fun,limits):在limits定义的自变量的取值范围【xmin,xmax】内,或者在自变量与因变量的取值范围【xmin,xmax;ymin,ymax】内,绘制fun函数。
(2)fplot(fun,limits,linspace):在limits定义的取值范围内,在linespace所规定的线型,标记,颜色等属性下,绘制fun函数。
(3)fplot(fun,limits,tol,linspace):tol表示在规定的相对误差内绘制fun(),默认值是2e-3,
(4)fplot(fun,limits,n):在limits定义的取值范围内绘制fun函数,至少绘制n+1个点。n的默认值是1,最大步长(xmax-xmin)/n。
function y = fun(x)
%UNTITLED2 Summary of this function goes here
%   Detailed explanation goes here
y=sin(1./tan(x*10));

end
>> fplot('fun',[-2:0.1:2])
>> fplot('fun',[-2:0.1:2],1e-4)
>> fplot('fun',[-2:2],1e-4)
>> fplot('fun',[-2:2])
五、ezplot指令用于绘制函数的某一自变量区域内的图形,
(1)ezplot(f),默认自变量范围是-2*pi<x<2*pi
(2)ezplot(f,[min,max]):设置x方向的自变量范围【min,max】,与轴按默认方式绘制函数
(3)ezplot(f,[xmin,xmax,ymin,ymax]):x方向的变量范围为【xmin,xmax】,y方向上的范围为【ymin,ymax】
(4)ezplot(x,y):按照默认方式绘制图像
(5)ezplot(x,y,[min,max]):按自变量范围为【min,max】绘制函数x,y;
function f = fun2(x,y)
%UNTITLED4 Summary of this function goes here
%   Detailed explanation goes here
f=sin(x)^2+4*cos(y)^2-4;


end
>> ezplot('fun2')六、特殊的坐标轴绘制
(1)semilogx函数
semilogx(x1,y1,linespecl,x2,y2),……
semilogx函数绘制图形时,x轴采用对数坐标,
(2)semilogy函数:y轴采用对数坐标
(3)loglog函数:x,y轴都采用对数坐标
>> x=10.*(0.1:0.1:4);
>> y=1./(x+100);
>> subplot(121)
>> semilogx(x,y)
>> subplot(122)
>> plot(x,y)
>>
七、二维特殊图形函数
(1)bar函数:绘制二维垂直条形图,用垂直条形显示向量或矩阵中的值,其调用格式如下:
bar(y):为每一个y中的元素画一条状
bar(x,y):在指定的横坐标x上画y,其中。x为严格单调的向量,如果y为矩阵,则bar函数分解为几个行向量,在指定的横坐标处分别画出。(注意:此时,x向量的长度必须和矩阵y的行数相同)
>> y=[1 2 3 4 5 ;11 3 2 4 5; 6 7 8 33 12]

y =

     1     2     3     4     5
    11     3     2     4     5
     6     7     8    33    12

>> subplot(221)
>> bar(x,y','stacked')
subplot(222)
bar(x,y','grouped')
y =
1 2 3 4 5
11 3 2 4 5
6 7 8 33 12
y =
|
Error: Expression or statement is incomplete or incorrect.
>> subplot(222)
>> bar(x,y','grouped')
>> subplot(223)
>> barh(x,y','statcked')
Error using barh (line 51)
Incorrect number of inputs for property-value pairs.
>> barh(x,y','stacked')
>> subplot(224)
>> barh(x,y','grouped')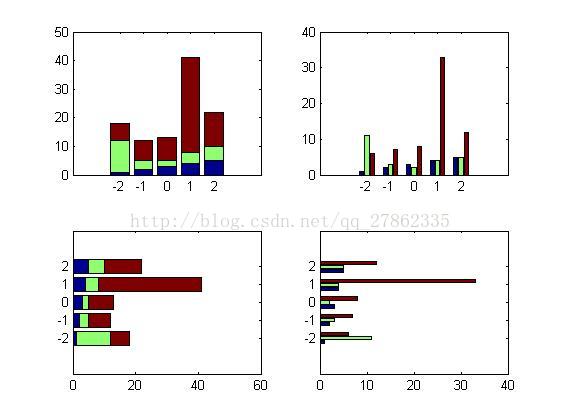
stacked :图像堆叠在一起
grouped:图像分开
bar横轴
barh:纵轴方向的
(2)pie函数
绘制饼状图
pie(x);绘制参数x的饼图
pie(x,explode):explode是与x同维的矩阵,若其中有非零元素,x矩阵中相应位置的元素在饼图中对应的扇形将向外移出,加以突出。
pie(……,labels):labels用于定义相应块的标签
pie(axes_handles,……):将图形绘制到坐标轴句柄axes_handle中,而不是当前坐标轴句柄中。
h=pie(……):返回绘制的饼图相关的句柄
pie3(x,explode):绘制三维饼图,
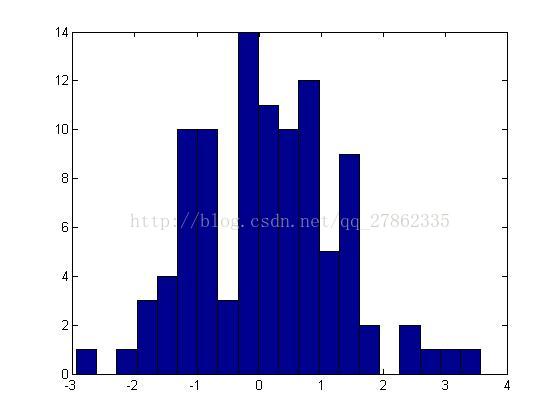
(3)hist函数
hiest函数用于绘制二维条形直方图,显示数据的分布;
所有向量y的元素或矩阵y的列向量中的元素是根据他们的数值范围来分组的,每一组作为一个条形图来显示。条形直方图中x轴反映了数据y中元素的数值范围,直方图的y轴显示出参量y中的元素落入该数组的数目,调用格式如下:
n=hist(y):把向量y中的元素放到等距的10个条形中,且返回每一条形图中的元素个数。若y为矩阵,则该命令按列对y进行处理。
n=hist(y,x):参量x为向量,把y中的元素放到m=length(x个由x中指定的位置为中心的条形中。
n=hist(y,nbins):参量nbins为标量,用于指定条形数目。
[n,xout]=hist(……):返回向量n与包含频率计数与条形图位置向量xout,可以用bar(xout,n),画出条形直方图
hist(……):生成直方图但不产生输出
hist(axes_handle,……):将图形会知道坐标轴句柄axes_handle中,而不是当前坐标轴句柄中。
>> y=randn(100,1);
>> hist(y,20)
>> 
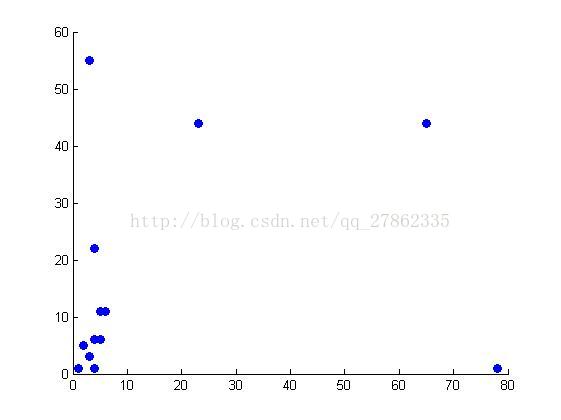
(4)scatter函数
用于绘制散点图。
scatter(x,y):以x,y的值为横,纵坐标绘制散点图。
>> x=[3 2 4 5  78  1  23 3 4 4 5  65 6]

x =

     3     2     4     5    78     1    23     3     4     4     5    65     6

>> y=[ 3   5  6 6 1 1  44 55 1  22 11 44 11]

y =

     3     5     6     6     1     1    44    55     1    22    11    44    11

>> whos x
  Name      Size            Bytes  Class     Attributes

  x         1x13              104  double

>> whos y
  Name      Size            Bytes  Class     Attributes

  y         1x13              104  double

>> scatter(x,y,'fill')
>> scatter(x,y,'fill')%绘制实心点的散点图