matplotlib 添加注释的方式
matplotlib.pyplot.annotate
Annotate the point xy with text s
s : str The text of the annotation
xy : iterable Length 2 sequence specifying the (x,y) point to annotate
xytext : iterable, optional Length 2 sequence specifying the (x,y) to place the text at. If None, defaults to xy.
xycoords : str, Artist, Transform, callable or tuple, optional
The coordinate system that xy is given in.
'data' use the coordinate system of the object being annotated (default)
textcoords : str, Artist, Transform, callable or tuple, optional
The coordinate system that xytext is given, which may be different than the coordinate system used for xy.
arrowprops : dict, optional
arrowstyle & connectionstyle: str, ConnectionStyle, or None, optional
The allowed values of 'arrowstyle' are:
| Name | Attrs |
|---|---|
'-' |
None |
'->' |
head_length=0.4,head_width=0.2 |
'-[' |
widthB=1.0,lengthB=0.2,angleB=None |
'|-|' |
widthA=1.0,widthB=1.0 |
'-|>' |
head_length=0.4,head_width=0.2 |
'<-' |
head_length=0.4,head_width=0.2 |
'<->' |
head_length=0.4,head_width=0.2 |
'<|-' |
head_length=0.4,head_width=0.2 |
'<|-|>' |
head_length=0.4,head_width=0.2 |
'fancy' |
head_length=0.4,head_width=0.4,tail_width=0.4 |
'simple' |
head_length=0.5,head_width=0.5,tail_width=0.2 |
'wedge' |
tail_width=0.3,shrink_factor=0.5 |
The following connection styles are available:
| Class | Name | Attrs |
|---|---|---|
| Angle | angle |
angleA=90,angleB=0,rad=0.0 |
| Angle3 | angle3 |
angleA=90,angleB=0 |
| Arc | arc |
angleA=0,angleB=0,armA=None,armB=None,rad=0.0 |
| Arc3 | arc3 |
rad=0.0 |
| Bar | bar |
armA=0.0,armB=0.0,fraction=0.3,angle=None |
import matplotlib.pyplot as plt
import numpy as np

#matplotlib.pyplot.annotate()函数的基本使用
x = np.linspace(-1,2,50)
y1 = 2*x +1
l1, =plt.plot(x,y1,label = 'one')


x0 = 0.5;
y0 = 2*x0 +1
plt.scatter(x0,y0,s = 50,color = 'r',lw= 2)#
plt.plot([x0,x0],[0,y0],'--')

x2 = 1.5;
y2 = 2*x2 +1
plt.scatter(x2,y2,s = 50,color = 'r',lw= 2)#
plt.plot([x2,x2],[0,y2],'--')

plt.annotate(r'$2x+1=%s$'%y2,xy = (x2,y2),xycoords = 'data',xytext= (+30,-30),textcoords = 'offset points'
             ,fontsize = 16,arrowprops = dict(arrowstyle = '->',connectionstyle = 'arc3,rad = .2'))
plt.annotate(r'$2x+1=%s$'%y0,xy = (x0,y0),xycoords = 'data',xytext= (+30,-30),textcoords = 'offset points'
             ,fontsize = 16,arrowprops = dict(arrowstyle = '->',connectionstyle = None))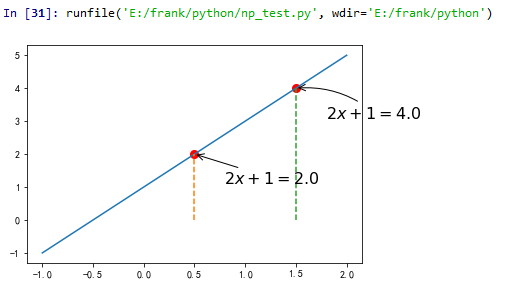
matplotlib.pyplot.text
Add text to the axes.
Add the text s to the axes at location x, y in data coordinates.
x, y : scalars
The position to place the text. By default, this is in data coordinates.
The coordinate system can be changed using the transform parameter.
s : str
The text.
fontdict : dictionary, optional, default: None
A dictionary to override the default text properties.
If fontdict is None, the defaults are determined by your rc parameters.
withdash : boolean, optional, default: False
Creates a TextWithDash instance instead of a Text instance.
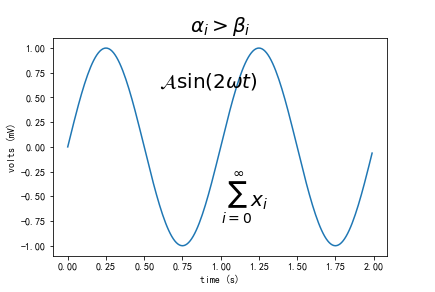
import matplotlib.pyplot as plt
import numpy as np

#matplotlib.pyplot.text()函数的基本使用
t = np.arange(0.0, 2.0, 0.01)
s = np.sin(2*np.pi*t)
plt.plot(t,s)
#标题
plt.title(r'$\alpha_i > \beta_i$', fontsize=20)
#在点(1,-0.6)处添加
plt.text(1, -0.6, r'$\sum_{i=0}^\infty x_i$', fontsize=20)
plt.text(0.6, 0.6, r'$\mathcal{A}\mathrm{sin}(2 \omega t)$',fontsize=20)
plt.xlabel('time (s)')
plt.ylabel('volts (mV)')
plt.show()