montage( ):
Display multiple image frames as rectangular montage(将多个图像框显示为矩形蒙太奇) , 蒙太奇原指影像与影像之间的关系而言.
load mri
montage(D,map)%D是2-D numeric array,Colormap, specified as an n-by-3 numeric array of class 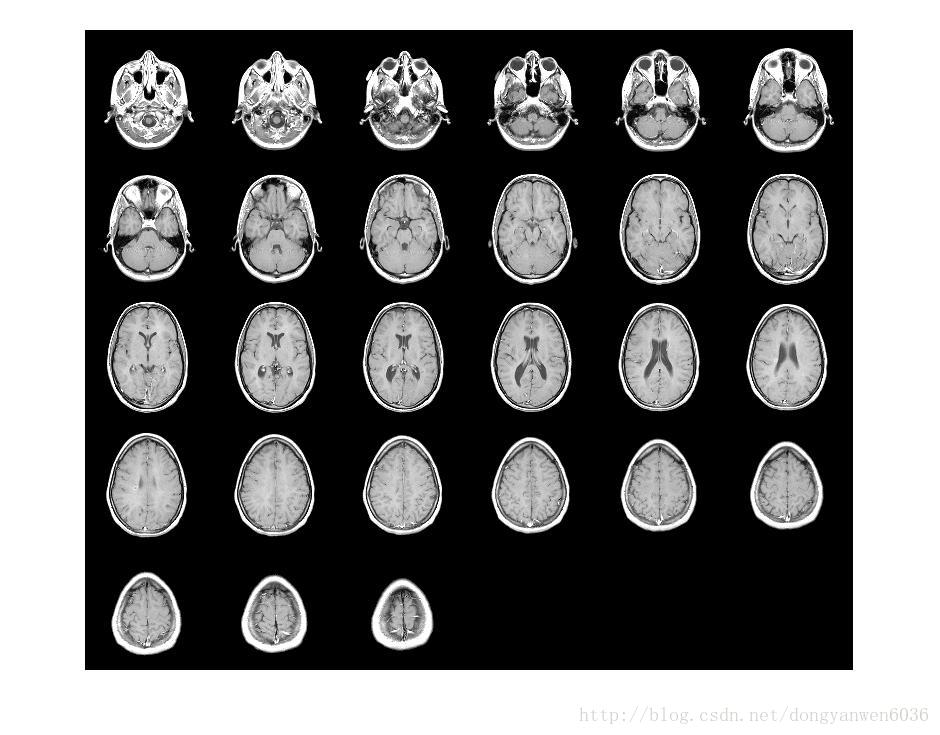
句法:
montage(imds)
montage(filenames)
montage(imagelist)
montage(I)
montage(X,map)
montage(___,Name,Value)
img = montage(___)
描述
figure
montage(D, map, 'Indices', 1:9);
官网错误:
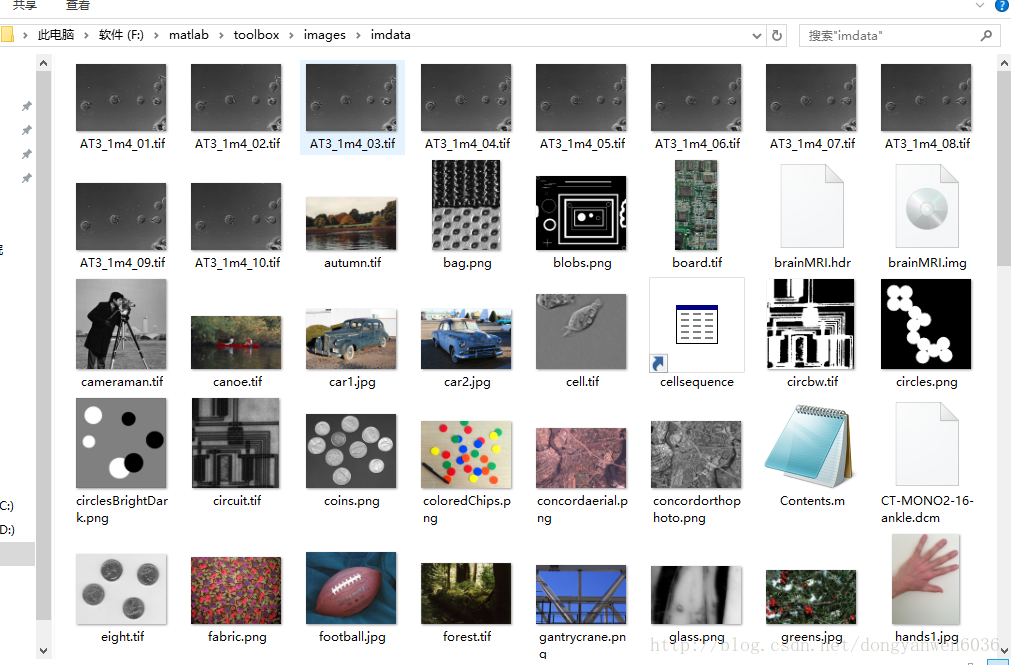
fileFolder = fullfile(matlabroot,'toolbox','images','imdata');
dirOutput = dir(fullfile(fileFolder,'AT3_1m4_*.tif'));
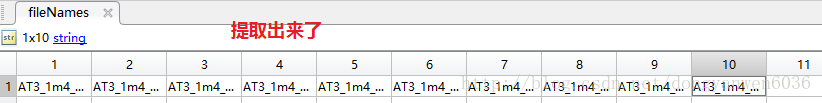
fileNames = string({dirOutput.name});%string err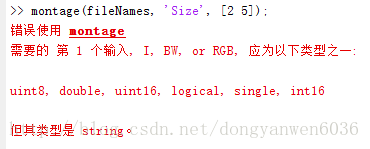
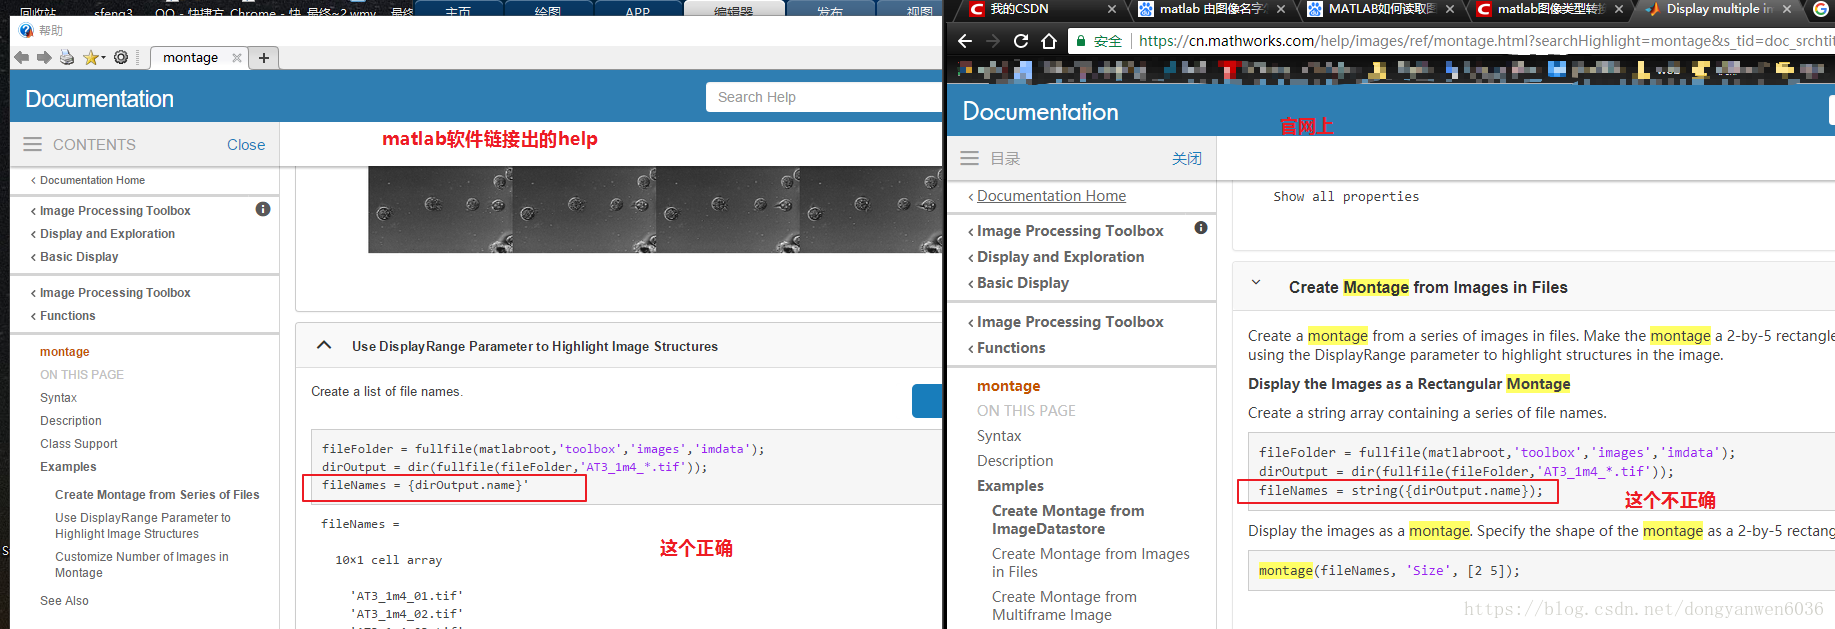
正确如下:
fileFolder = fullfile(matlabroot,'toolbox','images','imdata');
dirOutput = dir(fullfile(fileFolder,'AT3_1m4_*.tif'));
fileNames = {dirOutput.name}'%和转置没关系
montage(fileNames, 'Size', [2 5]);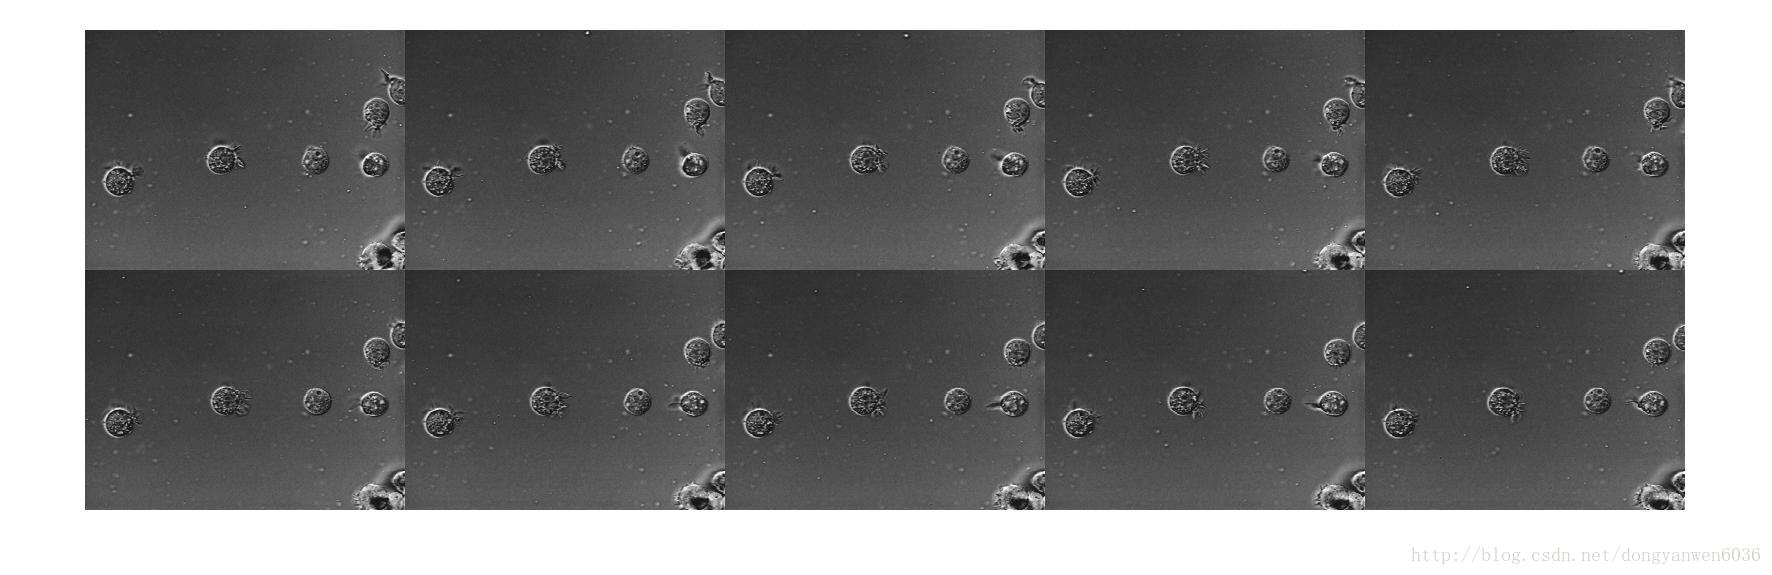
size 行数和列数 2-by-5:意为2*5
montage(fileNames, 'Size', [2 5],'DisplayRange', [75 200]);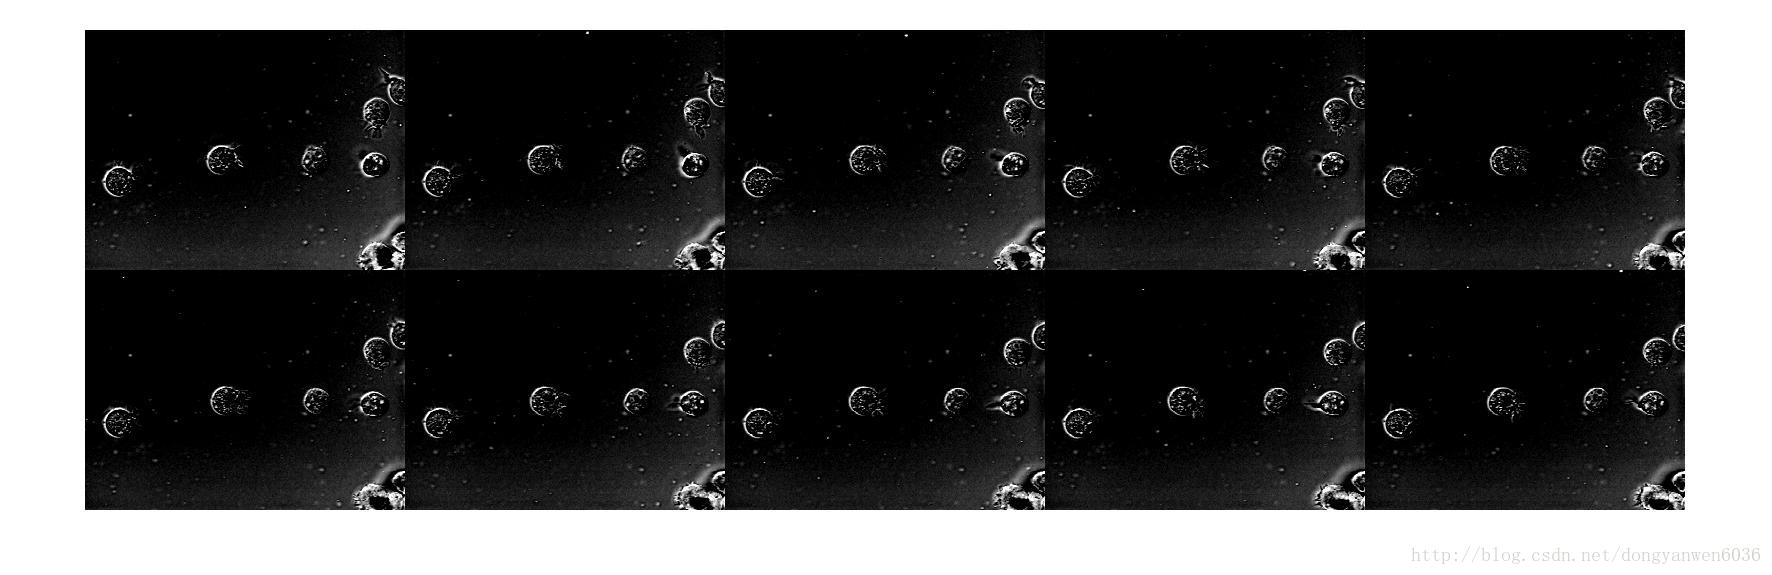
对应的路径下 的图库,由*看出就需要AT3_1m4_所有的:
DisplayRange 图像阵列中图像的显示范围. 如果指定空矩阵([]),将使用montage中显示的图像的最小值和最大值。高于默认值high就变白,低于默认low值变黑.
例如:
示例:
clear,clc;
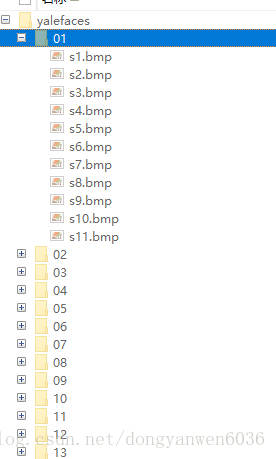
% save .bmp to .mat
yale=[];
for i=1:15 % 15 subjects
for j=1:11 % 11 images per subject
tmp=imread(sprintf('yalefaces/%02d/s%d.bmp',i,j));
yale(:,:,j,i)=imresize(tmp,0.5);%将图像的长宽缩小二分之一。
end
end
[height,width,nImg,nSub]=size(yale); % size of the 4D data
% show all images
figure;
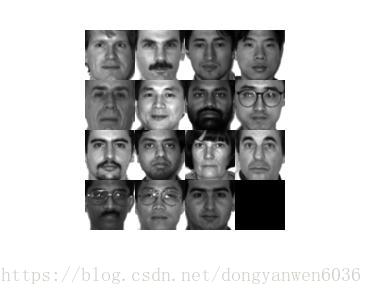
montage(reshape(yale,[height,width,1,nImg*nSub]),'DisplayRange',[],'size',[nSub,nImg]);
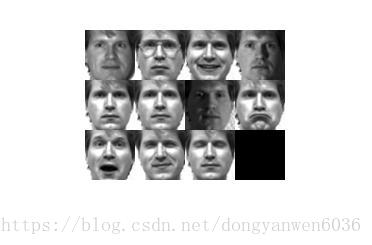
% show the first image of each subject
figure;
montage(yale(:,:,1,:),'DisplayRange',[]);
%show all of the 11 images of the first subject
figure;
montage(reshape(yale(:,:,:,1),height,width,1,11),'DisplayRange',[]);
% transform into 3D format
x=reshape(yale,[height,width,nImg*nSub]);
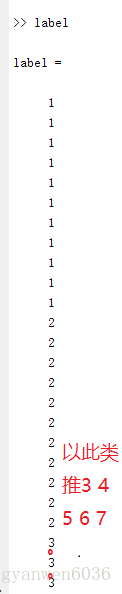
label=kron([1:nSub]',ones(nImg,1)); % labels
data_size=[height,width,nImg,nSub];
save('Yale.mat','x','label','data_size');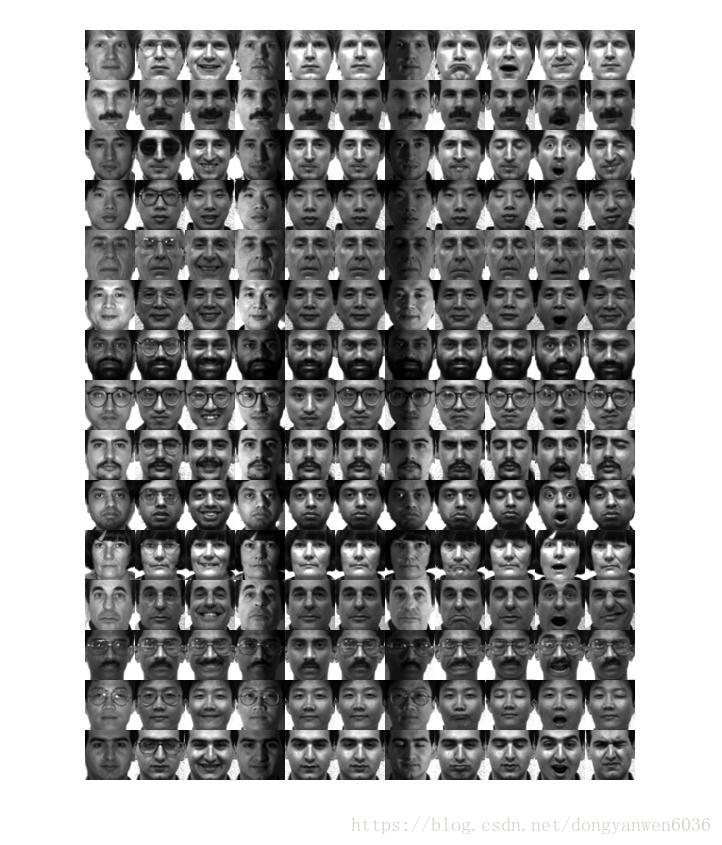
reshape: 重构数组
%将 6×6 幻方矩阵重构为仅具有 3 列的矩阵。为第一个维度大小指定 [] 以使 reshape 自动计算合适的行数。
A = magic(6);
B = reshape(A,[],4)
out:
B =

    35    28    26    10
     3     5    21    14
    31    36    22    18
     8     6    17    24
    30     7    12    25
     4     2    13    20
     1    33    19    15
    32    34    23    16
9 29 27 11解释montage(reshape(yale(:,:,1,:),height,width,15,1),'DisplayRange',[]); 为什么不行

对于第二个维度以上的维度,输出 B 不反映大小为 1 的尾部维度。例如,reshape(A,[3,2,1,1]) 生成 3×2 矩阵
reshape(yale(:,:,1,:),height,width,15,1)
比较
yale(:,:,1,:)
yale(:,:,:,1)
进一步
reshape(yale(:,:,:,1),height,width,1,11)
reshape(yale,[height,width,1,nImg*nSub])
这就表明只有4-D才能显示图像。
说明% transform into 3D format

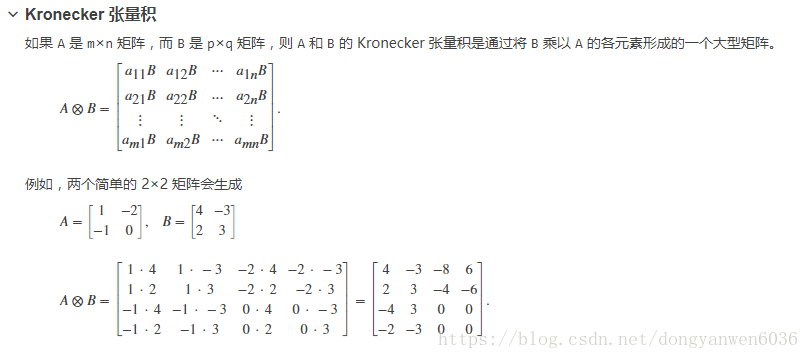
代码label=kron([1:nSub]',ones(nImg,1)); % labels说明Kronecker 张量积,K = kron(A,B) 返回矩阵 A 和 B 的 Kronecker 张量积。如果 A 是 m×n 矩阵,而 B 是 p×q 矩阵,则 kron(A,B) 是通过获取 A 元素与矩阵 B 元素之间的所有可能积而形成的一个 m*p×n*q 矩阵。
代码:[1:nSub]'