JMH,即Java Microbenchmark Harness,是专门用于代码微基准测试的工具套件。何谓Micro Benchmark呢?简单的来说就是基于方法层面的基准测试,精度可以达到微秒级。当你定位到热点方法,希望进一步优化方法性能的时候,就可以使用JMH对优化的结果进行量化的分析。
JMH比较典型的应用场景有:
- 想准确的知道某个方法需要执行多长时间,以及执行时间和输入之间的相关性;
- 对比接口不同实现在给定条件下的吞吐量,找到最优实现
- 查看多少百分比的请求在多长时间内完成
1、JMH环境搭建
 1     <dependency>
 2         <groupId>org.openjdk.jmh</groupId>
 3         <artifactId>jmh-core</artifactId>
 4         <version>0.7.1</version>
 5     </dependency>
 6     <dependency>
 7         <groupId>org.openjdk.jmh</groupId>
 8         <artifactId>jmh-generator-annprocess</artifactId>
 9         <version>0.7.1</version>
10         <scope>provided</scope>
11     </dependency>
12
13     <plugin>
14         <groupId>org.apache.maven.plugins</groupId>
15         <artifactId>maven-shade-plugin</artifactId>
16         <executions>
17             <execution>
18                 <phase>package</phase>
19                 <goals>
20                     <goal>shade</goal>
21                 </goals>
22                 <configuration>
23                     <finalName>microbenchmarks</finalName>
24                     <transformers>
25                         <transformer implementation="org.apache.maven.plugins.shade.resource.ManifestResourceTransformer">
26                             <mainClass>org.openjdk.jmh.Main</mainClass>
27                         </transformer>
28                     </transformers>
29                 </configuration>
30             </execution>
31         </executions>
32     </plugin>
2、用例(此用例用于对比Calendar和dateTime在高并发情况下的性能情况):
 1 package jmh;
 2 import java.util.Calendar;
 3 import java.util.concurrent.TimeUnit;
 4
 5 import org.joda.time.DateTime;
 6 import org.openjdk.jmh.annotations.Benchmark;
 7 import org.openjdk.jmh.annotations.BenchmarkMode;
 8 import org.openjdk.jmh.annotations.Mode;
 9 import org.openjdk.jmh.annotations.OutputTimeUnit;
10 import org.openjdk.jmh.annotations.Threads;
11 import org.openjdk.jmh.runner.Runner;
12 import org.openjdk.jmh.runner.options.Options;
13 import org.openjdk.jmh.runner.options.OptionsBuilder;
14
15 @OutputTimeUnit(TimeUnit.NANOSECONDS)
16 @BenchmarkMode(Mode.AverageTime)
17 public class JMHTest {
18
19     static int millis = 24 * 3600 * 1000;
20
21     public static void main(String[] args) throws Exception {
22         Options options = new OptionsBuilder().include(JMHTest.class.getName()).forks(1).build();
23         new Runner(options).run();
24     }
25
26     @Benchmark
27     @Threads(5)
28     public void runCalendar() {
29         Calendar calendar = Calendar.getInstance();
30     }
31
32     @Benchmark
33     @Threads(5)
34     public void runJoda() {
35         DateTime dateTime = new DateTime();
36     }
37
38     //
39     @Benchmark
40     @Threads(5)
41     public void runSystem() {
42         long result = System.currentTimeMillis() / millis;
43     }
44 }
3、执行
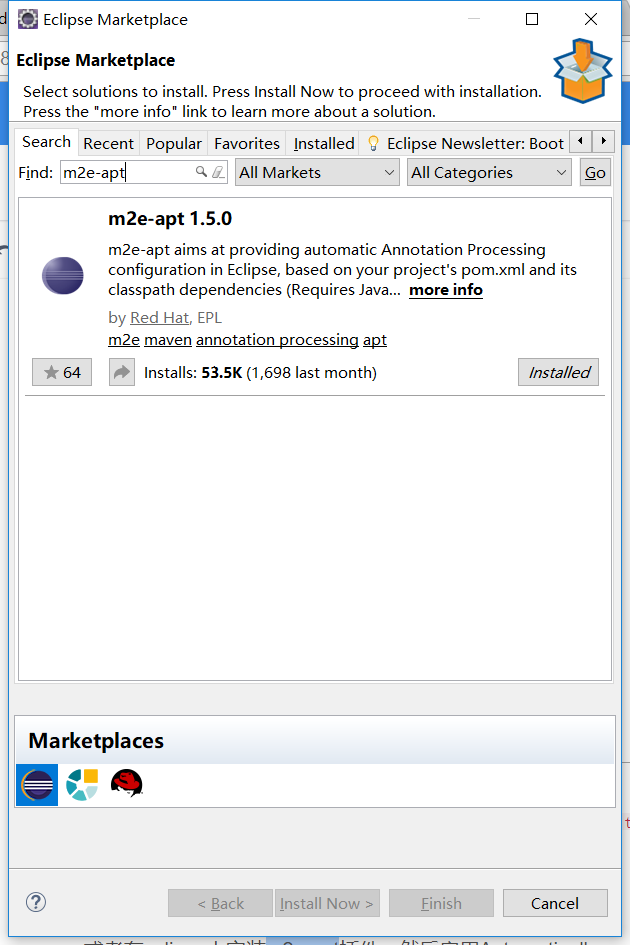
可能会遇到报错:
Exception in thread "main" java.lang.RuntimeException: ERROR: Unable to find the resource: /META-INF/BenchmarkList
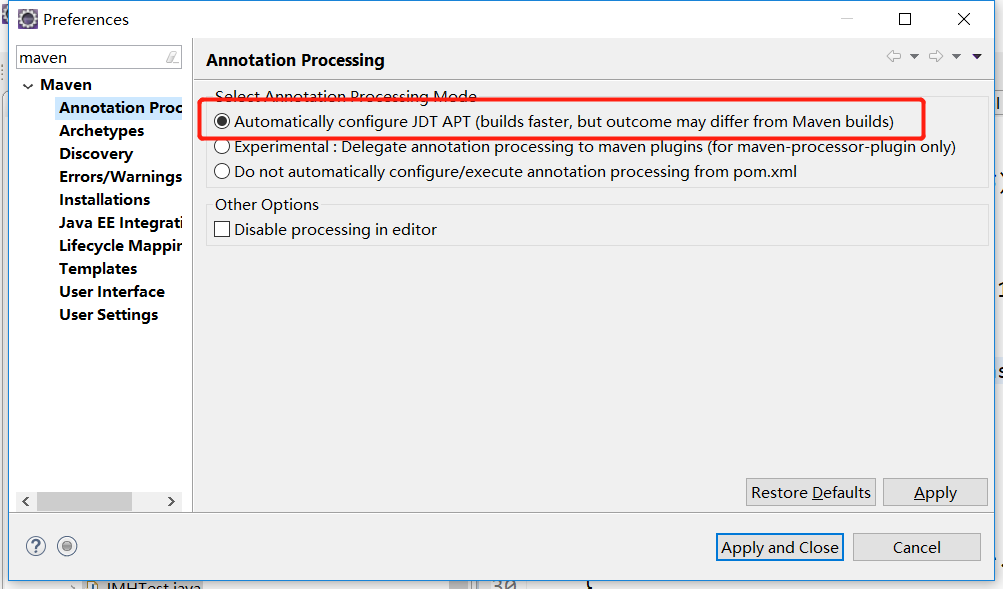
解决方法:
在eclipse中安装m2e-apt插件,然后启用Automatically configure JDT APT选项;
运行如果报错如下,是因为jmh不支持debug模式运行
# JMH version: 1.21
# VM version: JDK 1.8.0_91, Java HotSpot(TM) 64-Bit Server VM, 25.91-b15
# VM invoker: C:\Program Files\Java\jdk1.8.0_91\jre\bin\java.exe
# VM options: -agentlib:jdwp=transport=dt_socket,suspend=y,address=localhost:55262 -Dfile.encoding=UTF-8
# Warmup: 5 iterations, 10 s each
# Measurement: 5 iterations, 10 s each
# Timeout: 10 min per iteration
# Threads: 5 threads, will synchronize iterations
# Benchmark mode: Average time, time/op
# Benchmark: org.lz.apply.soa.JMHTest.runCalendar

# Run progress: 0.00% complete, ETA 00:05:00
# Fork: 1 of 1
FATAL ERROR in native method: JDWP No transports initialized, jvmtiError=AGENT_ERROR_TRANSPORT_INIT(197)
ERROR: transport error 202: connect failed: Connection refused
ERROR: JDWP Transport dt_socket failed to initialize, TRANSPORT_INIT(510)
JDWP exit error AGENT_ERROR_TRANSPORT_INIT(197): No transports initialized [debugInit.c:750]
<forked VM failed with exit code 1>
<stdout last='20 lines'>
FATAL ERROR in native method: JDWP No transports initialized, jvmtiError=AGENT_ERROR_TRANSPORT_INIT(197)
</stdout>
<stderr last='20 lines'>
ERROR: transport error 202: connect failed: Connection refused
ERROR: JDWP Transport dt_socket failed to initialize, TRANSPORT_INIT(510)
JDWP exit error AGENT_ERROR_TRANSPORT_INIT(197): No transports initialized [debugInit.c:750]
</stderr>

# JMH version: 1.21
# VM version: JDK 1.8.0_91, Java HotSpot(TM) 64-Bit Server VM, 25.91-b15
# VM invoker: C:\Program Files\Java\jdk1.8.0_91\jre\bin\java.exe
# VM options: -agentlib:jdwp=transport=dt_socket,suspend=y,address=localhost:55262 -Dfile.encoding=UTF-8
# Warmup: 5 iterations, 10 s each
# Measurement: 5 iterations, 10 s each
# Timeout: 10 min per iteration
# Threads: 5 threads, will synchronize iterations
# Benchmark mode: Average time, time/op
# Benchmark: org.lz.apply.soa.JMHTest.runJoda

# Run progress: 0.00% complete, ETA 00:05:00
# Fork: 1 of 1
FATAL ERROR in native method: JDWP No transports initialized, jvmtiError=AGENT_ERROR_TRANSPORT_INIT(197)
ERROR: transport error 202: connect failed: Connection refused
ERROR: JDWP Transport dt_socket failed to initialize, TRANSPORT_INIT(510)
JDWP exit error AGENT_ERROR_TRANSPORT_INIT(197): No transports initialized [debugInit.c:750]
<forked VM failed with exit code 1>
<stdout last='20 lines'>
FATAL ERROR in native method: JDWP No transports initialized, jvmtiError=AGENT_ERROR_TRANSPORT_INIT(197)
</stdout>
<stderr last='20 lines'>
ERROR: transport error 202: connect failed: Connection refused
ERROR: JDWP Transport dt_socket failed to initialize, TRANSPORT_INIT(510)
JDWP exit error AGENT_ERROR_TRANSPORT_INIT(197): No transports initialized [debugInit.c:750]
</stderr>

# JMH version: 1.21
# VM version: JDK 1.8.0_91, Java HotSpot(TM) 64-Bit Server VM, 25.91-b15
# VM invoker: C:\Program Files\Java\jdk1.8.0_91\jre\bin\java.exe
# VM options: -agentlib:jdwp=transport=dt_socket,suspend=y,address=localhost:55262 -Dfile.encoding=UTF-8
# Warmup: 5 iterations, 10 s each
# Measurement: 5 iterations, 10 s each
# Timeout: 10 min per iteration
# Threads: 5 threads, will synchronize iterations
# Benchmark mode: Average time, time/op
# Benchmark: org.lz.apply.soa.JMHTest.runSystem

# Run progress: 0.00% complete, ETA 00:05:00
# Fork: 1 of 1
FATAL ERROR in native method: JDWP No transports initialized, jvmtiError=AGENT_ERROR_TRANSPORT_INIT(197)
ERROR: transport error 202: connect failed: Connection refused
ERROR: JDWP Transport dt_socket failed to initialize, TRANSPORT_INIT(510)
JDWP exit error AGENT_ERROR_TRANSPORT_INIT(197): No transports initialized [debugInit.c:750]
<forked VM failed with exit code 1>
<stdout last='20 lines'>
FATAL ERROR in native method: JDWP No transports initialized, jvmtiError=AGENT_ERROR_TRANSPORT_INIT(197)
</stdout>
<stderr last='20 lines'>
ERROR: transport error 202: connect failed: Connection refused
ERROR: JDWP Transport dt_socket failed to initialize, TRANSPORT_INIT(510)
JDWP exit error AGENT_ERROR_TRANSPORT_INIT(197): No transports initialized [debugInit.c:750]
</stderr>

# Run complete. Total time: 00:00:00

REMEMBER: The numbers below are just data. To gain reusable insights, you need to follow up on
why the numbers are the way they are. Use profilers (see -prof, -lprof), design factorial
experiments, perform baseline and negative tests that provide experimental control, make sure
the benchmarking environment is safe on JVM/OS/HW level, ask for reviews from the domain experts.
Do not assume the numbers tell you what you want them to tell.

Benchmark  Mode  Cnt  Score   Error  Units
ERROR: JDWP Unable to get JNI 1.2 environment, jvm->GetEnv() return code = -2
JDWP exit error AGENT_ERROR_NO_JNI_ENV(183):  [util.c:840]
改为run运行之后运行结果:
# JMH version: 1.21
# VM version: JDK 1.8.0_91, Java HotSpot(TM) 64-Bit Server VM, 25.91-b15
# VM invoker: C:\Program Files\Java\jdk1.8.0_91\jre\bin\java.exe
# VM options: -Dfile.encoding=UTF-8
# Warmup: 5 iterations, 10 s each
# Measurement: 5 iterations, 10 s each
# Timeout: 10 min per iteration
# Threads: 5 threads, will synchronize iterations
# Benchmark mode: Average time, time/op
# Benchmark: org.lz.apply.soa.JMHTest.runCalendar

# Run progress: 0.00% complete, ETA 00:05:00
# Fork: 1 of 1
# Warmup Iteration   1: 625.707 ±(99.9%) 24.593 ns/op
# Warmup Iteration   2: 623.766 ±(99.9%) 41.928 ns/op
# Warmup Iteration   3: 639.438 ±(99.9%) 8.543 ns/op
# Warmup Iteration   4: 651.421 ±(99.9%) 25.146 ns/op
# Warmup Iteration   5: 638.751 ±(99.9%) 26.477 ns/op
Iteration   1: 631.098 ±(99.9%) 14.580 ns/op
Iteration   2: 603.567 ±(99.9%) 25.887 ns/op
Iteration   3: 609.097 ±(99.9%) 24.528 ns/op
Iteration   4: 638.006 ±(99.9%) 20.327 ns/op
Iteration   5: 614.077 ±(99.9%) 33.736 ns/op


Result "org.lz.apply.soa.JMHTest.runCalendar":
  619.169 ±(99.9%) 56.722 ns/op [Average]
  (min, avg, max) = (603.567, 619.169, 638.006), stdev = 14.731
  CI (99.9%): [562.446, 675.891] (assumes normal distribution)


# JMH version: 1.21
# VM version: JDK 1.8.0_91, Java HotSpot(TM) 64-Bit Server VM, 25.91-b15
# VM invoker: C:\Program Files\Java\jdk1.8.0_91\jre\bin\java.exe
# VM options: -Dfile.encoding=UTF-8
# Warmup: 5 iterations, 10 s each
# Measurement: 5 iterations, 10 s each
# Timeout: 10 min per iteration
# Threads: 5 threads, will synchronize iterations
# Benchmark mode: Average time, time/op
# Benchmark: org.lz.apply.soa.JMHTest.runJoda

# Run progress: 33.33% complete, ETA 00:03:22
# Fork: 1 of 1
# Warmup Iteration   1: 38.363 ±(99.9%) 6.992 ns/op
# Warmup Iteration   2: 34.713 ±(99.9%) 2.364 ns/op
# Warmup Iteration   3: 35.779 ±(99.9%) 2.657 ns/op
# Warmup Iteration   4: 36.549 ±(99.9%) 2.201 ns/op
# Warmup Iteration   5: 34.805 ±(99.9%) 3.346 ns/op
Iteration   1: 33.694 ±(99.9%) 2.354 ns/op
Iteration   2: 34.348 ±(99.9%) 2.880 ns/op
Iteration   3: 34.194 ±(99.9%) 3.279 ns/op
Iteration   4: 35.187 ±(99.9%) 4.125 ns/op
Iteration   5: 35.056 ±(99.9%) 3.453 ns/op


Result "org.lz.apply.soa.JMHTest.runJoda":
  34.496 ±(99.9%) 2.395 ns/op [Average]
  (min, avg, max) = (33.694, 34.496, 35.187), stdev = 0.622
  CI (99.9%): [32.101, 36.890] (assumes normal distribution)


# JMH version: 1.21
# VM version: JDK 1.8.0_91, Java HotSpot(TM) 64-Bit Server VM, 25.91-b15
# VM invoker: C:\Program Files\Java\jdk1.8.0_91\jre\bin\java.exe
# VM options: -Dfile.encoding=UTF-8
# Warmup: 5 iterations, 10 s each
# Measurement: 5 iterations, 10 s each
# Timeout: 10 min per iteration
# Threads: 5 threads, will synchronize iterations
# Benchmark mode: Average time, time/op
# Benchmark: org.lz.apply.soa.JMHTest.runSystem

# Run progress: 66.67% complete, ETA 00:01:41
# Fork: 1 of 1
# Warmup Iteration   1: 8.881 ±(99.9%) 1.253 ns/op
# Warmup Iteration   2: 8.773 ±(99.9%) 1.206 ns/op
# Warmup Iteration   3: 9.506 ±(99.9%) 0.462 ns/op
# Warmup Iteration   4: 9.496 ±(99.9%) 0.490 ns/op
# Warmup Iteration   5: 9.122 ±(99.9%) 0.220 ns/op
Iteration   1: 9.085 ±(99.9%) 0.172 ns/op
Iteration   2: 9.341 ±(99.9%) 0.326 ns/op
Iteration   3: 9.254 ±(99.9%) 0.293 ns/op
Iteration   4: 9.021 ±(99.9%) 0.164 ns/op
Iteration   5: 9.294 ±(99.9%) 0.359 ns/op


Result "org.lz.apply.soa.JMHTest.runSystem":
  9.199 ±(99.9%) 0.534 ns/op [Average]
  (min, avg, max) = (9.021, 9.199, 9.341), stdev = 0.139
  CI (99.9%): [8.665, 9.733] (assumes normal distribution)


# Run complete. Total time: 00:05:03

REMEMBER: The numbers below are just data. To gain reusable insights, you need to follow up on
why the numbers are the way they are. Use profilers (see -prof, -lprof), design factorial
experiments, perform baseline and negative tests that provide experimental control, make sure
the benchmarking environment is safe on JVM/OS/HW level, ask for reviews from the domain experts.
Do not assume the numbers tell you what you want them to tell.

Benchmark            Mode  Cnt    Score    Error  Units
JMHTest.runCalendar  avgt    5  619.169 ± 56.722  ns/op
JMHTest.runJoda      avgt    5   34.496 ±  2.395  ns/op
JMHTest.runSystem    avgt    5    9.199 ±  0.534  ns/op
测试结果表明:
runCalendar方法平均运行时间为:619微秒
runJoda方法的平均运行时间为:34微秒
据用例测试结果可以看到,Calendar(非线程安全)在高并发情况下性能远远比不上dateTime(线程安全)。对代码性能和安全性要求比较高的可以放弃使用Calendar和SimpleDateFormat(底层实现是Calendar),转而使用joda-time
4、基本概念
Mode
Mode 表示 JMH 进行 Benchmark 时所使用的模式。通常是测量的维度不同,或是测量的方式不同。目前 JMH 共有四种模式:
- Throughput: 整体吞吐量,例如“1秒内可以执行多少次调用”。
- AverageTime: 调用的平均时间,例如“每次调用平均耗时xxx毫秒”。
- SampleTime: 随机取样,最后输出取样结果的分布,例如“99%的调用在xxx毫秒以内,99.99%的调用在xxx毫秒以内”
- SingleShotTime: 以上模式都是默认一次 iteration 是 1s,唯有 SingleShotTime 是只运行一次。往往同时把 warmup 次数设为0,用于测试冷启动时的性能。
Iteration
Iteration 是 JMH 进行测试的最小单位。在大部分模式下,一次 iteration 代表的是一秒,JMH 会在这一秒内不断调用需要 benchmark 的方法,然后根据模式对其采样,计算吞吐量,计算平均执行时间等。
Warmup
Warmup 是指在实际进行 benchmark 前先进行预热的行为。为什么需要预热?因为 JVM 的 JIT 机制的存在,如果某个函数被调用多次之后,JVM 会尝试将其编译成为机器码从而提高执行速度。为了让 benchmark 的结果更加接近真实情况就需要进行预热。
5、注解与选项
@BenchmarkMode
对应Mode选项,可用于类或者方法上, 需要注意的是,这个注解的value是一个数组,可以把几种Mode集合在一起执行,还可以设置为Mode.All,即全部执行一遍。
@State
类注解,JMH测试类必须使用@State注解,State定义了一个类实例的生命周期,可以类比Spring Bean的Scope。由于JMH允许多线程同时执行测试,不同的选项含义如下:
- Scope.Thread:默认的State,每个测试线程分配一个实例;
- Scope.Benchmark:所有测试线程共享一个实例,用于测试有状态实例在多线程共享下的性能;
- Scope.Group:每个线程组共享一个实例;
@OutputTimeUnit
benchmark 结果所使用的时间单位,可用于类或者方法注解,使用java.util.concurrent.TimeUnit中的标准时间单位。
@Benchmark
方法注解,表示该方法是需要进行 benchmark 的对象。
@Setup
方法注解,会在执行 benchmark 之前被执行,正如其名,主要用于初始化。
@TearDown
方法注解,与@Setup 相对的,会在所有 benchmark 执行结束以后执行,主要用于资源的回收等。
@Param
成员注解,可以用来指定某项参数的多种情况。特别适合用来测试一个函数在不同的参数输入的情况下的性能。@Param注解接收一个String数组,在@setup方法执行前转化为为对应的数据类型。多个@Param注解的成员之间是乘积关系,譬如有两个用@Param注解的字段,第一个有5个值,第二个字段有2个值,那么每个测试方法会跑5*2=10次。
6、参考资料