第一步、安装Influxdb
首先启动docker
systemctl start docker
然后安装Influxdb(这里解释一下为啥用docker,因为官网下载的话需要FQ【fan-qiang】,真悲催)注意切换root用户
[root@localhost admin]# docker pull influxdb
Using default tag: latest
Trying to pull repository docker.io/library/influxdb ...
latest: Pulling from docker.io/library/influxdb
55cbf04beb70: Pull complete
1607093a898c: Pull complete
9a8ea045c926: Pull complete
4c8b66fe6495: Pull complete
9f3c67b9b082: Pull complete
864cc6881ca8: Pull complete
c1165c5c85e6: Pull complete
0b5bd48b7b2b: Pull complete
Digest: sha256:c9098612611038b6d0daddf1ed89d0144f41124b0feed765c0d31844e7f32e9f
Status: Downloaded newer image for docker.io/influxdb:latest
[root@localhost admin]# docker images
REPOSITORY              TAG                 IMAGE ID            CREATED             SIZE
docker.io/mongo         latest              8bf72137439e        9 days ago          380 MB
docker.io/influxdb      latest              34de2bdc2d7f        13 days ago         213 MB
docker.io/centos        latest              5182e96772bf        13 days ago         200 MB
docker.io/hello-world   latest              2cb0d9787c4d        5 weeks ago         1.85 kB
启动Influxdb
[root@localhost admin]# docker run -d -p 8083:8083 -p 8086:8086 --name my_influxdb influxdb
aec85244ff227e3175afcba59dc7293001428e4b21300c09c5567becac270635
[root@localhost admin]# docker ps
CONTAINER ID        IMAGE               COMMAND                  CREATED             STATUS              PORTS                                            NAMES
aec85244ff22        influxdb            "/entrypoint.sh in..."   8 seconds ago       Up 5 seconds        0.0.0.0:8083->8083/tcp, 0.0.0.0:8086->8086/tcp   my_influxdb
其实这一步可以省略8083端口,因为新版本根本就移除了web控制台部分,网上大多数教程还是0.8 或者 1.1版本的,他们那个有web控制台(其实14、15年的文章用低版本无可厚非,现在有的人2018年7月份的教程都用的0.8版本,我想问有意思吗?)
进入docker镜像:
[root@localhost admin]# docker exec -it my_influxdb bash
进入/usr/bin目录,这里面有Influxdb的工具
root@aec85244ff22:/usr/bin# find | grep influx
./influx
./influx_inspect
./influx_stress
./influx_tsm
./influxd
查看Influxdb版本
./influx -version
进入Influxdb客户端命令行
root@aec85244ff22:/usr/bin# ./influx
Connected to http://localhost:8086 version 1.6.1
InfluxDB shell version: 1.6.1
> show databases
name: databases
name
----
_internal
> exit
创建数据库
> create database my_test
> show databases
name: databases
name
----
_internal
my_test
删除数据库
drop database [db_name]
使用数据库
> use my_test
Using database my_test
现在写个定时程序,不断向数据库添加数据
建立一个SpringBoot工程
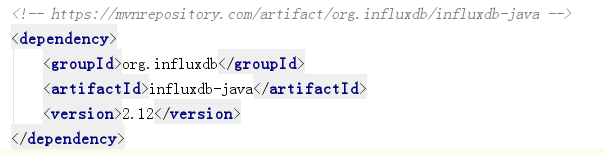
导入依赖
入口类
package com.example.demo;


import org.springframework.boot.SpringApplication;
import org.springframework.boot.autoconfigure.SpringBootApplication;
import org.springframework.scheduling.annotation.EnableScheduling;
import org.springframework.scheduling.annotation.Scheduled;

import java.util.Random;

@SpringBootApplication
@EnableScheduling
public class DemoApplication {

    public static void main(String[] args) {
        SpringApplication.run(DemoApplication.class, args);
    }


    @Scheduled(fixedRate = 1000)
    public void doInsert(){
        Random random = new Random();
        InfluxDBDemo.insert(random.nextInt(1000));
    }

}
Influxdb类
package com.example.demo;

import org.influxdb.InfluxDB;
import org.influxdb.InfluxDBFactory;
import org.influxdb.dto.Point;


public class InfluxDBDemo {

    public static void insert(int num){
        InfluxDB db = InfluxDBFactory.connect("http://192.168.192.128:8086", "admin", "admin");
        db.setDatabase("my_test");  // 设置数据库
        Point.Builder builder = Point.measurement("test_measurement");  // 创建Builder,设置表名
        builder.addField("count",num);  // 添加Field
        builder.tag("TAG_CODE","TAG_VALUE_" + num);    // 添加Tag
        Point point = builder.build();
        db.write(point);
    }
}
当你启动,每隔1秒自动向数据库添加
这个时候,显示表列表
> show measurements
name: measurements
name
----
test_measurement
查看表
> select * from test_measurement
name: test_measurement
time                TAG_CODE      count
----                --------      -----
1534754858345040970 TAG_VALUE_655 655
1534754859072609138 TAG_VALUE_42  42
1534754860076519190 TAG_VALUE_881 881
1534754861077128121 TAG_VALUE_461 461
1534754862079956555 TAG_VALUE_374 374
1534754863079020432 TAG_VALUE_574 574
1534754864073986943 TAG_VALUE_647 647
1534754865077651294 TAG_VALUE_78  78
1534754866079569554 TAG_VALUE_688 688
删除表
drop measurement 【measurement_name】
第二步、安装Grafana
相比之下,grafana就比较友好了,因为官网上的都能下载,无论Windows还是linux。
[root@localhost admin]# docker pull grafana/grafana
Using default tag: latest
Trying to pull repository docker.io/grafana/grafana ...
latest: Pulling from docker.io/grafana/grafana
be8881be8156: Pull complete
728ffd1b8130: Pull complete
426111690cea: Pull complete
Digest: sha256:b5591419cfa3a930cecdddff0a338c03296d29b617d9f340dc72ee839dd1c5be
Status: Downloaded newer image for docker.io/grafana/grafana:latest
运行
[root@localhost admin]# docker run -d -p 3000:3000 --name my_grafana grafana/grafana
6c9d5d2d8422e666ca44403c5c47be3fa43308b4d2a9587ab16ad97fcffede24
打开防火墙端口,以便你本机能访问虚拟机资源
[root@localhost admin]# firewall-cmd --zone=public --add-port=8086/tcp --permanent
success
[root@localhost admin]# firewall-cmd --zone=public --add-port=3000/tcp --permanent
success
[root@localhost admin]# systemctl restart firewalld
访问 http://192.168.192.128:3000
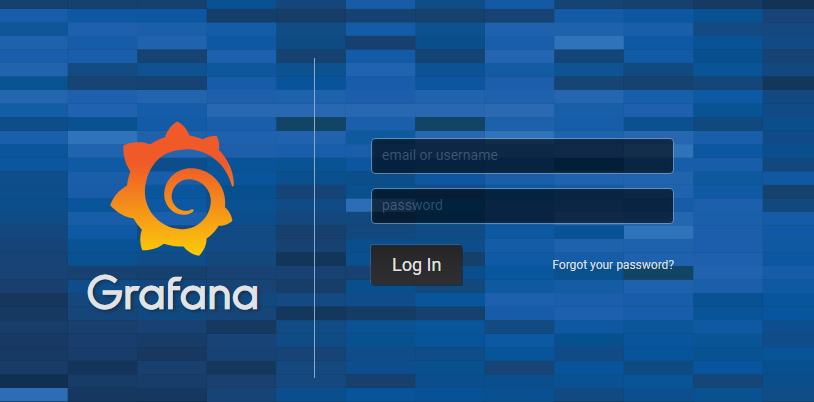
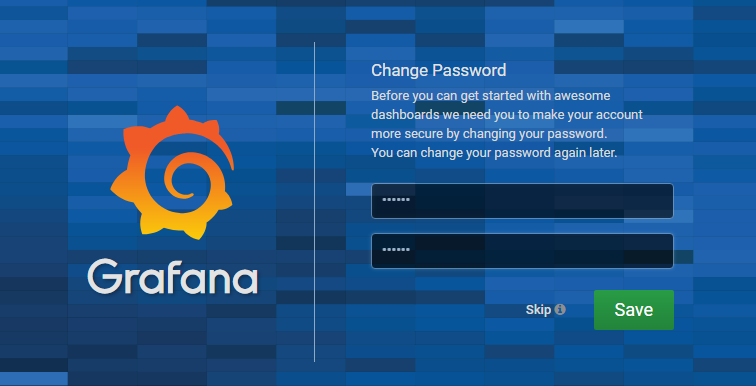
账号密码:admin/admin,进去之后让你修改密码
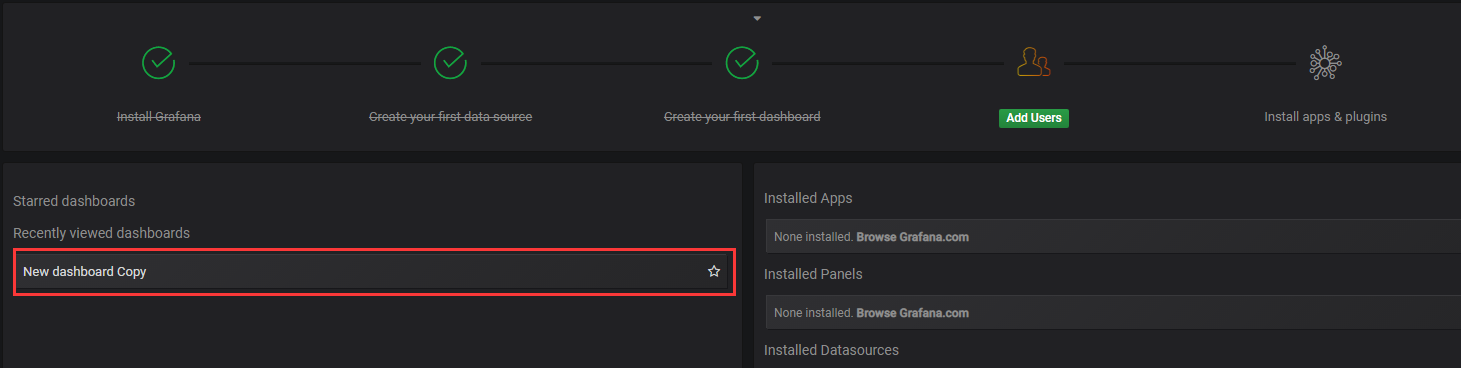
进去之后
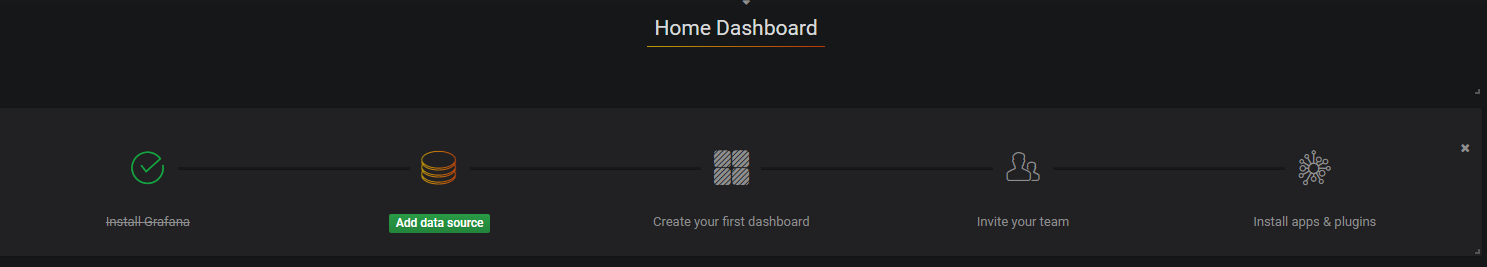
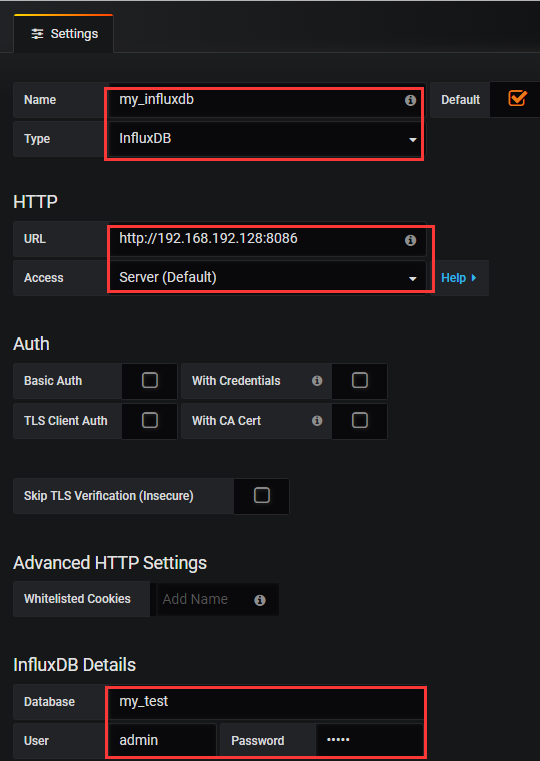
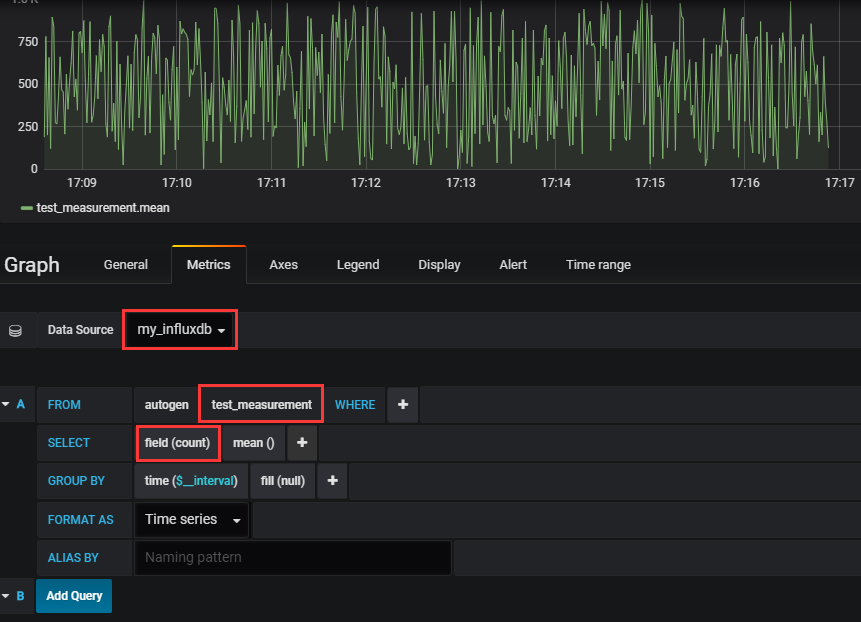
现在配置数据源
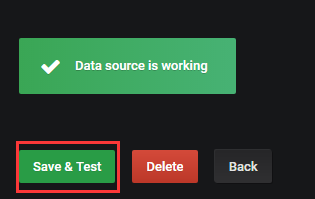
最后点击
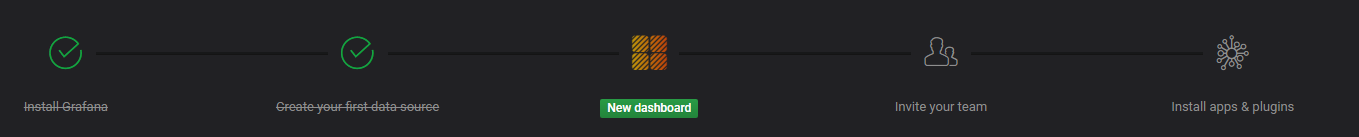
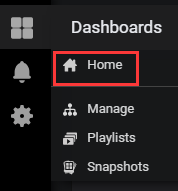
然后点击,选择Home

..添加dashboard
..
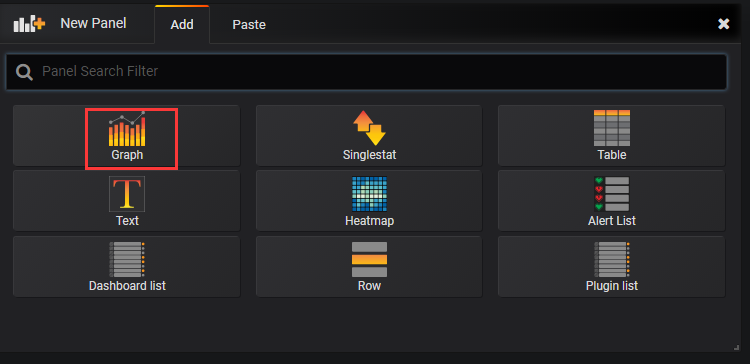
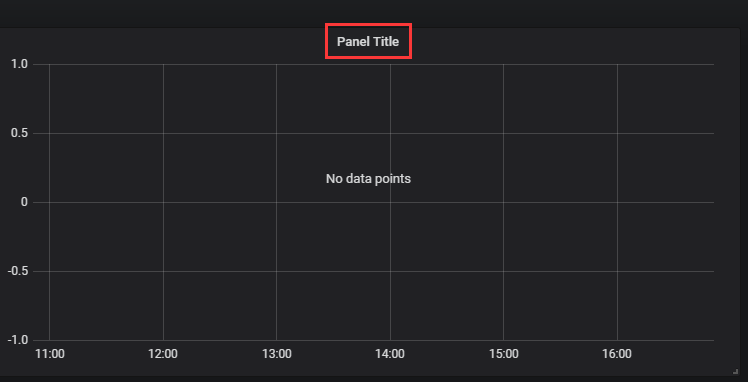
..点击Panel Title
..
..
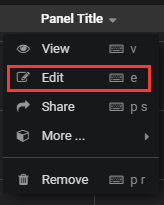
..在右上角可以设置展示效果

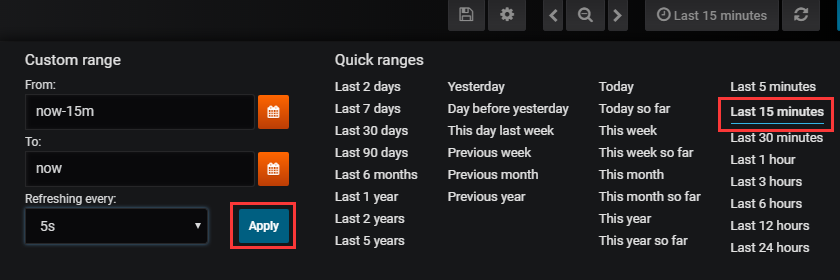
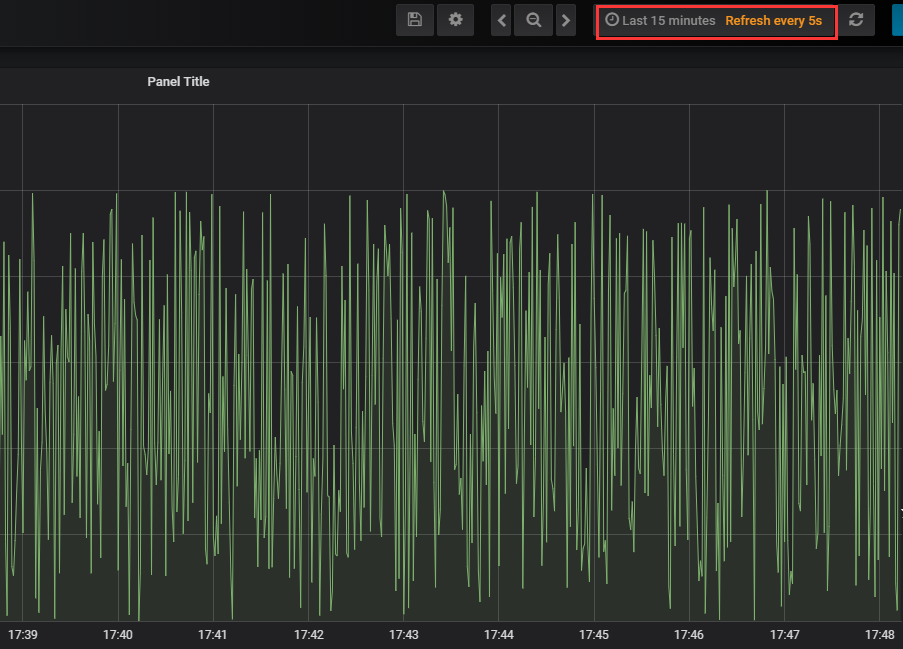
设置自动刷新,选择时间范围,然后选择刷新间隔,注意点击Apply。这样每隔5s,自动刷新
..效果
..最后回到Home
..可以看到我们刚才创建的监控图