以实际例子来阐释整个实现过程。
1.测试驱动如下(定时获取某个cpu的当前频率和最高频率):
#include <linux/init.h>
#include <linux/kernel.h>
#include <linux/kernel_stat.h>
#include <linux/kobject.h>
#include <linux/module.h>
#include <linux/slab.h>
#include <linux/sysfs.h>
#include <linux/tick.h>
#include <linux/types.h>
#include <linux/cpu.h>
#include <linux/err.h>
#include <linux/delay.h>
#include <linux/kthread.h>
#include <linux/cpufreq.h>
#include <linux/cpumask.h>
#include <linux/cpu.h>

/*must define,or build error*/
#define CREATE_TRACE_POINTS
#include <trace/events/test_driver.h>

#define TEST_DRIVER_DELAY          (50 * HZ)
#define THREAD_BIND_CPU             (0)

struct timer_list test_timer;

struct test_data {
    unsigned long num;
    unsigned long cpu_freq;
    unsigned long cpu_max_freq;
};

struct test_data *global;

static unsigned long i = 0;

static void test_driver_func(unsigned long data)
{
    unsigned long expires;

    global->num = (i + 1) % NR_CPUS;
    global->cpu_freq = cpufreq_quick_get((i + 1) % NR_CPUS);
    global->cpu_max_freq = cpufreq_quick_get_max((i + 1) % NR_CPUS);
    trace_get_test_driver_data(global->num, global->cpu_freq, global->cpu_max_freq);
    /*dynamic modify timer expires time*/
    expires = jiffies + msecs_to_jiffies(2000 + i * 200);
    mod_timer(&test_timer, expires);
    if(i > 100)
        i = 0;
    i++;
}

static int __init test_driver_init(void)
{
    init_timer_deferrable(&test_timer);
    test_timer.function = test_driver_func;
    test_timer.data = 0;
    test_timer.expires = jiffies + TEST_DRIVER_DELAY;
    add_timer_on(&test_timer, THREAD_BIND_CPU);
    global = kzalloc(sizeof(struct test_data), GFP_KERNEL);
    if(!global) {
        printk(KERN_INFO "alloc space is fail\n");
        return -1;
    }
    return 0;
}

static void __exit test_driver_exit(void)
{
    struct test_data *test = global;
    kfree(test);
    del_timer_sync(&test_timer);
}

module_init(test_driver_init);
module_exit(test_driver_exit);

MODULE_AUTHOR("samarxie");
MODULE_LICENSE("GPL");
MODULE_DESCRIPTION("TEST DRIVER FOR TRACE USE");
由于是完全添加自己的trace point,所以在include/trace/events/目录下添加自己的event文件,我命名为:test_driver.h,代码如下:
#undef TRACE_SYSTEM
#define TRACE_SYSTEM test_driver

#if !defined(_TRACE_TEST_DRIVER_H) || defined(TRACE_HEADER_MULTI_READ)
#define _TRACE_TEST_DRIVER_H

#include <linux/tracepoint.h>

/**
 * Two methodes can achieve capture trace.
 * 1. Dedine trace class, can include many events.
 * 2. Direct definition trace one event.
 */

/*method 1*/
DECLARE_EVENT_CLASS(get_cpu_info,
    TP_PROTO(unsigned long cpu_id, unsigned long curr_freq,
             unsigned long max_freq),
    TP_ARGS(cpu_id, curr_freq, max_freq),

    TP_STRUCT__entry(
        __field(unsigned long, cpu_id    )
        __field(unsigned long, curr_freq   )
        __field(unsigned long, max_freq )
       ),

    TP_fast_assign(
        __entry->cpu_id = cpu_id;
        __entry->curr_freq = curr_freq;
        __entry->max_freq = max_freq;
    ),

    TP_printk("cpu=%lu curr_freq=%lu max_freq=%lu",
          __entry->cpu_id, __entry->curr_freq,
          __entry->max_freq)
);

DEFINE_EVENT(get_cpu_info, get_test_driver_data,
    TP_PROTO(unsigned long cpu_id, unsigned long curr_freq,
         unsigned long max_freq),
    TP_ARGS(cpu_id, curr_freq, max_freq)
);


#if 0
/*method 2*/
TRACE_EVENT(get_test_driver_data,
    TP_PROTO(unsigned long cpu_id, unsigned long curr_freq,
        unsigned long max_freq),

    TP_ARGS(cpu_id, curr_freq, max_freq),

    TP_STRUCT__entry(
        __field(unsigned long, cpu_id    )
        __field(unsigned long, curr_freq   )
        __field(unsigned long, max_freq )
       ),

    TP_fast_assign(
        __entry->cpu_id = cpu_id;
        __entry->curr_freq = curr_freq;
        __entry->max_freq = max_freq;
    ),

    TP_printk("cpu=%lu curr_freq=%lu max_freq=%lu",
          __entry->cpu_id, __entry->curr_freq,
          __entry->max_freq)
);
#endif

#endif /* _TRACE_TEST_DRIVER_H */

/* This part must be outside protection */
#include <trace/define_trace.h>
可以看到在定义trace的时候,有两种方式:
- 一种是类,class,这种使用在,如果你定义的多个时间的信息(参数)是相同,但是可能是不同的时间点或者某种上下文前后,就可以使用,比单独定义event要省事些
- 一种是直接定义event。目的很单纯的获取一种都有的信息。
编译系统,刷boot reboot之后,可以看到新的trace event目录:
meizu1000:/ # ls /d/tracing/events/test_driver/ -l
total 0
-rw-r--r-- 1 root root 0 2018-08-23 14:59 enable
-rw-r--r-- 1 root root 0 2018-08-23 15:01 filter
drwxr-xr-x 2 root root 0 1970-01-01 08:00 get_test_driver_data
使用trace-cmd抓取信息:
meizu1000:/data # trace-cmd record -e test_driver* -e timer* 使用ctrl+c中断抓取之后,将data目录下的trace.dat文件pull处理,使用kernelshark解析出来如下,由于加了timer的trace event,所以我对event过滤了一下,解析的图片如下图所示:

至此成功添加自己想要的trace event和trace point。对于Android,可以添加很多event在systrace上面展示出来看系统行为。debug performance真的很方便。
下面的内容是转载自:https://zhuanlan.zhihu.com/p/27190018 感兴趣的可以研究ftrace源码!
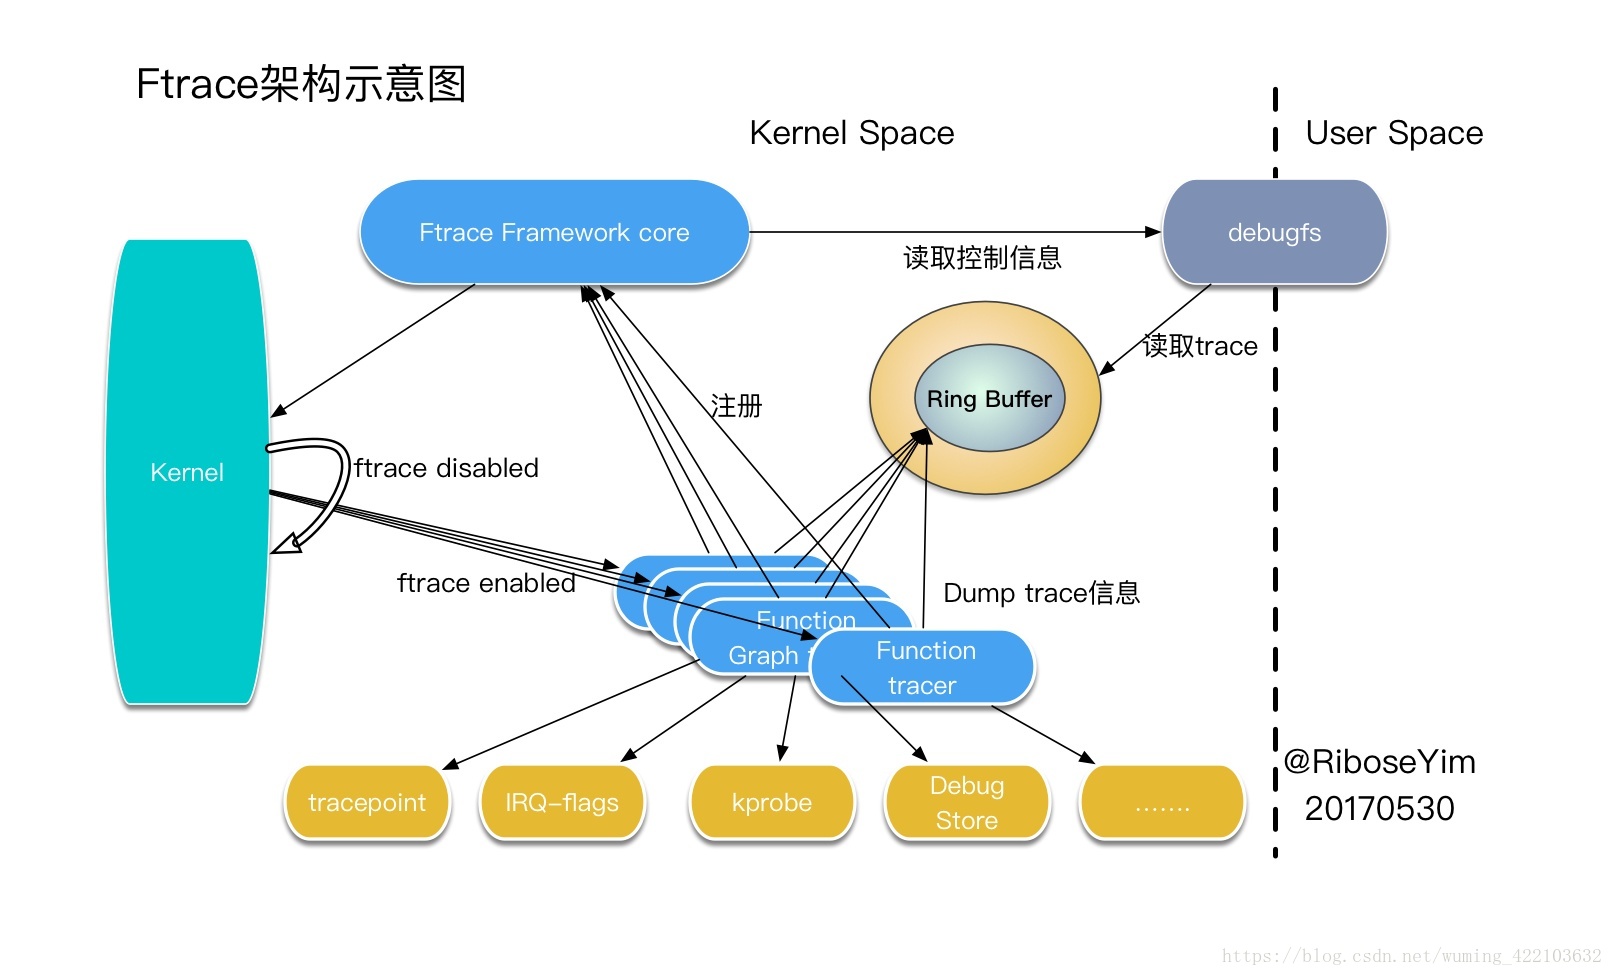
动态追踪技术及其体系结构:

体系结构:
Ftrace有两大组成部分,framework和一系列的tracer 。每个tracer完成不同的功能,它们统一由framework管理。 ftrace 的trace信息保存在ring buffer中,由framework负责管理。Framework 利用debugfs建立tracing目录,并提供了一系列的控制文件。
参考文献:
1. http://tinylab.org/ftrace-principle-and-practice/ 强烈推荐之首,真的很好,架构,代码分析
2. https://blog.csdn.net/pwl999/article/details/80702365 强烈推荐二,更加透彻,代码级别透彻分析
3. https://www.ibm.com/developerworks/cn/linux/1609_houp_ftrace/index.html
4. https://zhuanlan.zhihu.com/p/27190018
5. http://lixiang7.lofter.com/post/1b42fc_96d3e5
感谢前辈的付出,开源就是这么有趣!!!