<!DOCTYPE html>
<html lang="en">
<head>
<meta charset="UTF-8">
<title>ECharts</title>
</head>
<body>
<!---------------------------------------------------------- 矩形图----------------------------------------------------->
<!-- 为ECharts准备一个具备大小(宽高)的Dom -->
<div id="main" style="height:400px;width: 700px"></div>
<!--ECharts单文件引入 -->
<script src="http://echarts.baidu.com/build/dist/echarts.js"></script>
<script type="text/javascript">
var myChart = "";
// 路径配置
require.config({
paths: {
echarts: 'http://echarts.baidu.com/build/dist'
}
});
// 使用
require(
[
'echarts',
'echarts/chart/bar' // 使用柱状图就加载bar模块,按需加载
],
function (ec) {
// 基于准备好的dom,初始化echarts图表
myChart = ec.init(document.getElementById('main'));
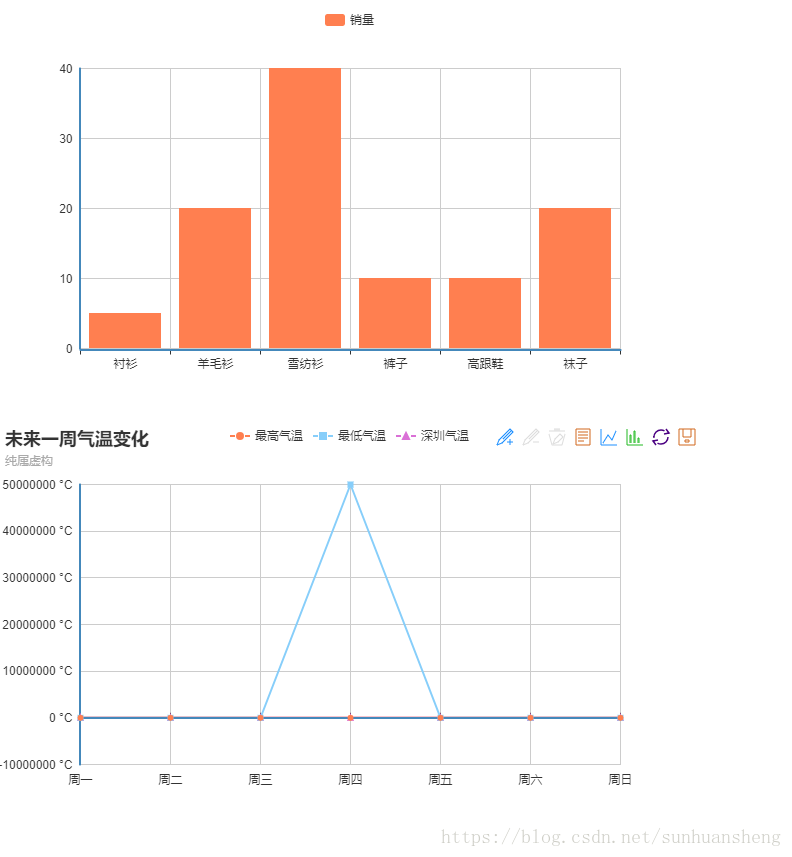
var option = {
tooltip: {
show: true
},
legend: {
data:['销量']
},
xAxis : [
{
type : 'category',
data : ["衬衫","羊毛衫","雪纺衫","裤子","高跟鞋","袜子"]
}
],
yAxis : [
{
type : 'value'
}
],
series : [
{
"name":"销量",
"type":"bar",
"data":[5, 20, 40, 10, 10, 20]
}
]
};
// 为echarts对象加载数据
myChart.setOption(option);
}
);
</script>
<!---------------------------------------------------------- 折线图----------------------------------------------------->
<!-- 为ECharts准备一个具备大小(宽高)的Dom -->
<div id="main2" style="height:400px;width: 700px"></div>
<!-- ECharts单文件引入 -->
<script src="http://echarts.baidu.com/build/dist/echarts.js"></script>
<script type="text/javascript">
// 路径配置
require.config({
paths: {
echarts: 'http://echarts.baidu.com/build/dist'
}
});
// 使用
require(
[
'echarts',
'echarts/chart/line' // 使用柱状图就加载bar模块,按需加载
],
function (ec) {
// 基于准备好的dom,初始化echarts图表
var myChart = ec.init(document.getElementById('main2'));
var option1 = {
title : {
text: '未来一周气温变化',
subtext: '纯属虚构'
},
tooltip : {
trigger: 'axis'
},
legend: {
data:['最高气温','最低气温','深圳气温']
},
grid:{
containLabel:true
},
calculable : true,
toolbox: {
show : true,
feature : {
mark : {show: true},
dataView : {show: true, readOnly: false},
magicType : {show: true, type: ['line', 'bar']},
restore : {show: true},
saveAsImage : {show: true}
}
},
xAxis : [
{
type : 'category',
boundaryGap : false,
data : ['周一','周二','周三','周四','周五','周六','周日']
}
],
yAxis : [
{
type : 'value',
axisLabel : {
formatter: '{value} °C'
}
}
],
series : [
{
name:'最高气温',
type:'line',
data:[11, 11, 15, 13, 12, 13, 10],
},
{
name:'最低气温',
type:'line',
data:[1, -2, 2, 50000000, 3, 2, 0],
},
{
name:'深圳气温',
type:'line',
data:[6, -2, 3, 5, 3, 2, 14],
}
]
};
// 为echarts对象加载数据
myChart.setOption(option1);
}
);
</script>
</body>
</html>
Echarts 图表插件学习(1)-- 折线图,矩形图
猜你喜欢
转载自blog.csdn.net/sunhuansheng/article/details/81533946
今日推荐
周排行