一.图表添加的级数和坐标轴的关系
void MainWindow::newChartview()
{
    //new 新的线
    series = new QSplineSeries();
    //加速
    series->setUseOpenGL(true);
    series->setName("TextLine");
    //new 第二条线
    series_1 = new QSplineSeries();
    //加速
    series_1->setUseOpenGL(true);
    series_1->setName("TextLine");
    //new 新的图表
    chart = new QChart;
    //设置legend的显示位置
    chart->legend()->setAlignment(Qt::AlignBottom);
    //设置legend隐藏
    chart->legend()->hide();
    //图表添加线
    chart->addSeries(series);
    chart->addSeries(series_1);
    chart->setTitle("Text-SpLine");
    //创建图表坐标轴
    chart->createDefaultAxes();
    //设置坐标轴的区间
    chart->axisX()->setRange(0,100);
    chart->axisY()->setRange(0,100);
    //设置图表动画
    chart->setAnimationOptions(QChart::NoAnimation);
    //new 新的chartview
    chartview = new QChartView(chart);
    //设置橡皮筋(放大缩小)
    chartview->setRubberBand(QChartView::HorizontalRubberBand);
    //设置抗锯齿
    chartview->setRenderHint(QPainter::Antialiasing);
    //设置chartview大小
    chartview->resize(1000,300);
    //设置series的点击信号
    connect(series,SIGNAL(clicked(QPointF)),this,SLOT(splineseriesslot()));
    connect(series_1,SIGNAL(clicked(QPointF)),this,SLOT(removeseriesslot()));
}
先创建图表
显示在界面上:
ui->gridLayout->addWidget(chartview,0,0,1,4);
//创建图表坐标轴
chart->createDefaultAxes();
//设置坐标轴的区间
chart->axisX()->setRange(0,100);
chart->axisY()->setRange(0,100);
只有当我们执行了chart->createDefaultAxes(),这句之后,图表会自动将之前的坐标轴清除并添加新的坐标轴
根据QT文档:
void QChart::createDefaultAxes()
Creates axes for the chart based on the series that have already been added to the chart. Any axes previously added to the chart will be deleted.
Note: This function has to be called after all series have been added to the chart. The axes created by this function will NOT get automatically attached to any series added to the chart after this function has been called. A series with no axes attached will by default scale to utilize the entire plot area of the chart, which can be confusing if there are other series with properly attached axes also present.
如果在添加线之后没有加入这句或者之后再加入线的话,那么这条新的线不会根据你当前的坐标轴进行自适应大小!
那么我们做个测试:
void MainWindow::removeseriesslot()
{
    chart->removeSeries(series);
    chart->addSeries(series);
}
我们将线移除再添加之后效果如下:
初始化:
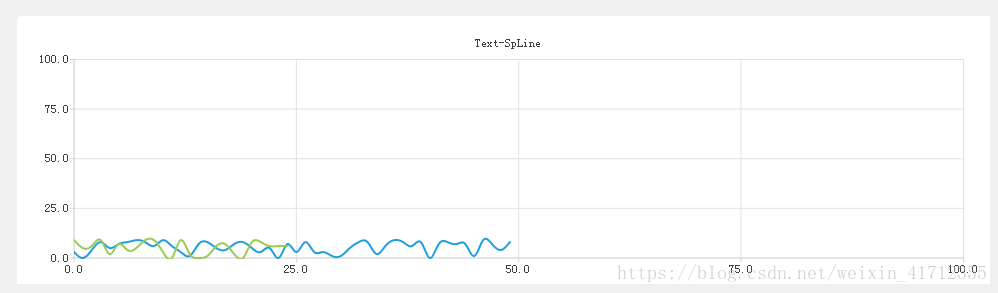
点击线执行removeseriesslot()之后:
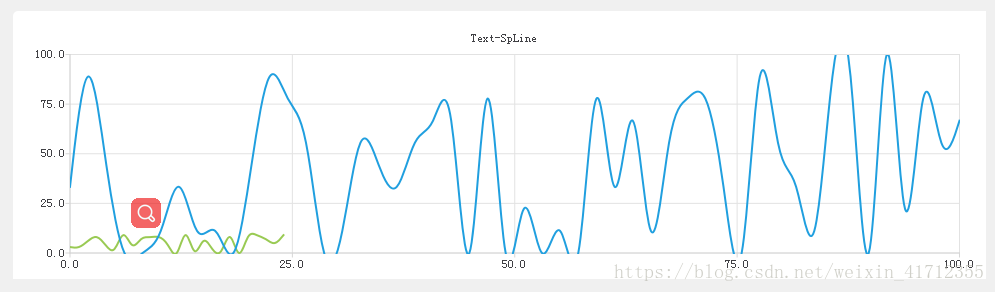
结果表明:
当我们创建新的坐标轴之后,上面原本的线会自适应坐标轴的坐标级数!当你使用setRange改变坐标的级数时,线的大小长度会跟随坐标轴改变而改变。but当你将线移除出去并再次添加线而没有调用chart->createDefaultAxes();,那么这根线的大小并不会自适应当前坐标轴的级数!
二.使用线程添加图表数据
改
最近在使用线程将数据添加进图表
大致使用两种方法:
一种是直接series->append(i,qrand()%50);
另一种是先将series移除,然后使用series->append(i,qrand()%50);再将series加入chart!
现在我们使用程序运行时间来判断,如何获取代码运行时间 : 使用GetTickCount函数
#include<iostream>
#include<windows.h>
int main()
{
DWORD start_time=GetTickCount();
{
//此处为被测试代码
}
DWORD end_time=GetTickCount();
cout<<"The run time is:"<<(end_time-start_time)<<"ms!"<<endl;//输出运行时间
return 0;
}
GetTickCount函数返回从系统运行到现在所经历的时间(类型为DWORD),单位为ms,因为DWORD表示范围的限制,所以使用此种方法存在限制,即系统的运行时间的ms表示不能超出DWORD的表示范围。