在经过五天的学习和资料收集后,终于初步实现了利用sqldependency进行数据库变化监控,signalr进行前后台交互,数据实时更新。下面将源代码贴出进行初步分析:
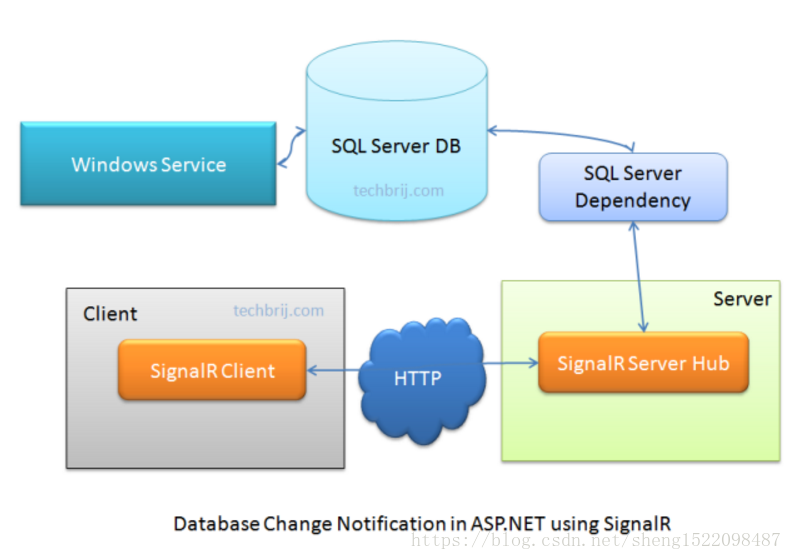
1.系统整体框架构成:
2.具体代码分析:
1.signalr交互(利用persistence connection)
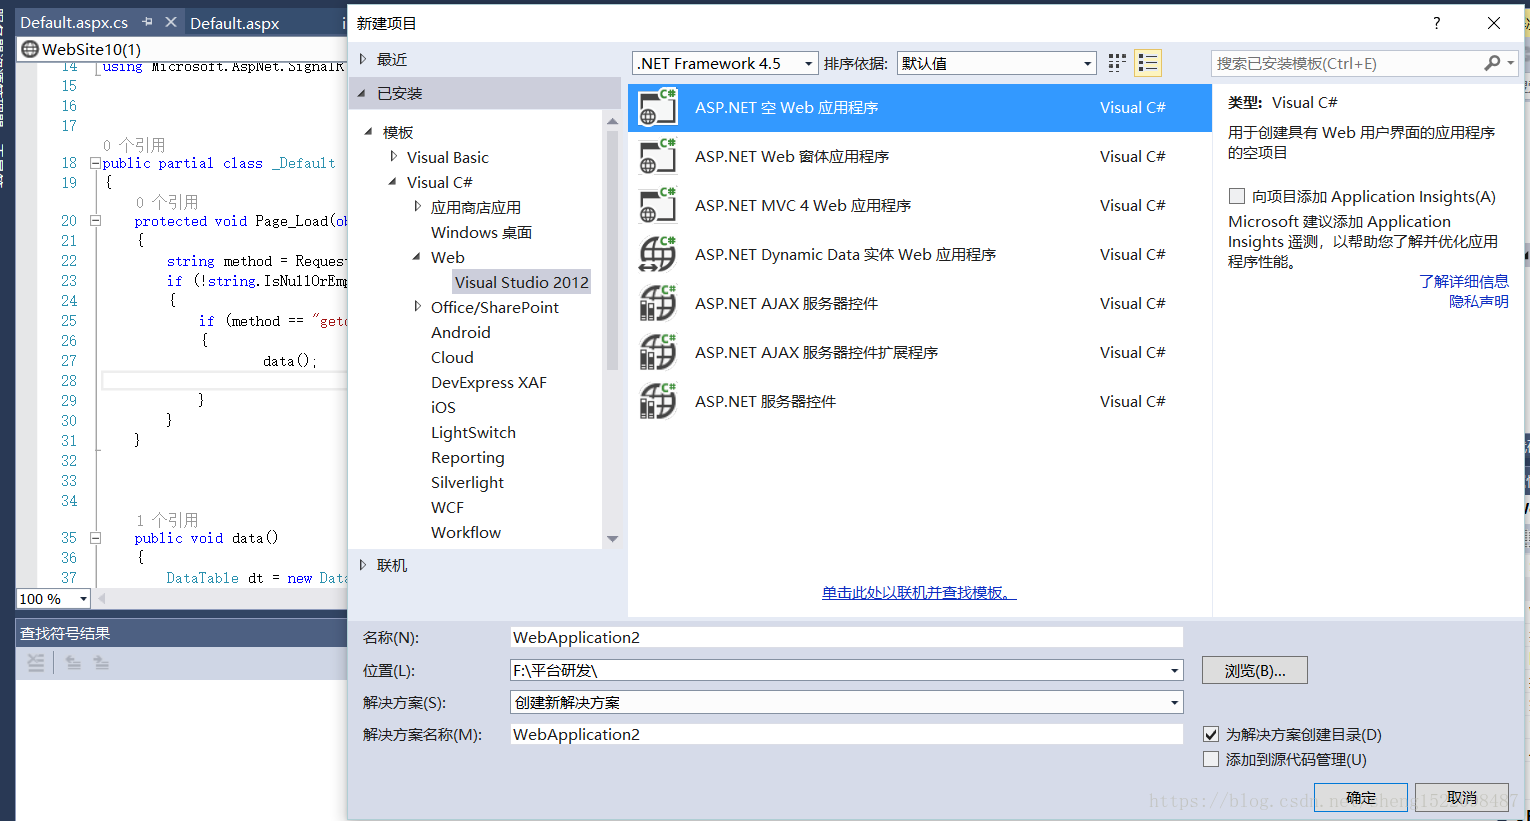
a.新建web程序
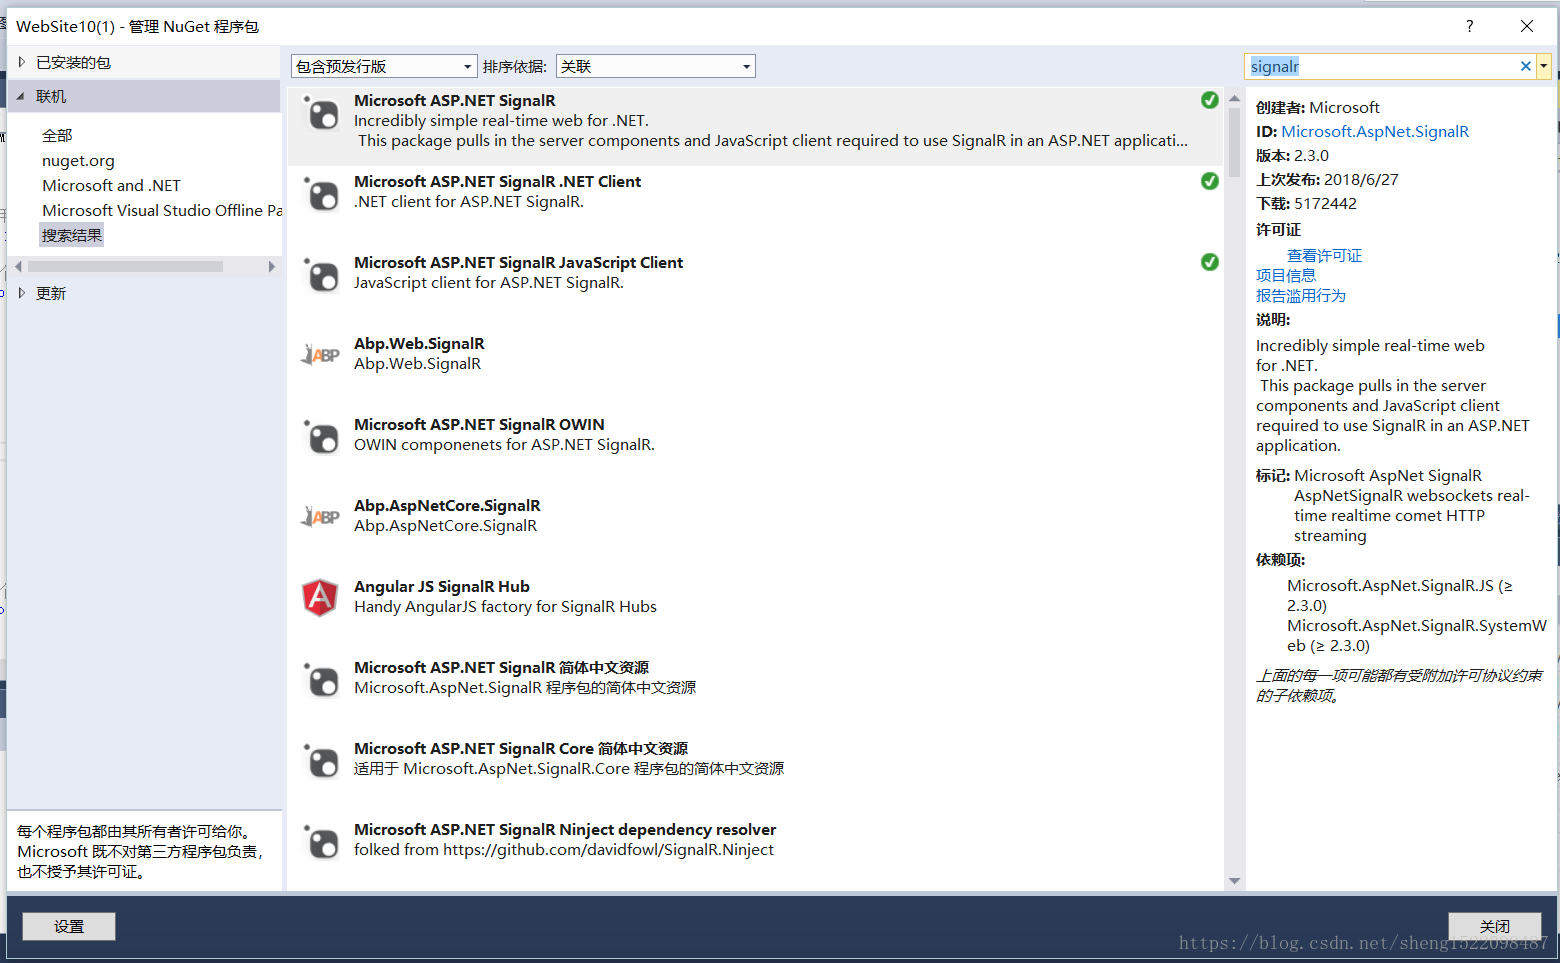
b.引入Signalr(通过nuget包引入)
c.使用persistence connection模式(当然也可以使用Hub模式)
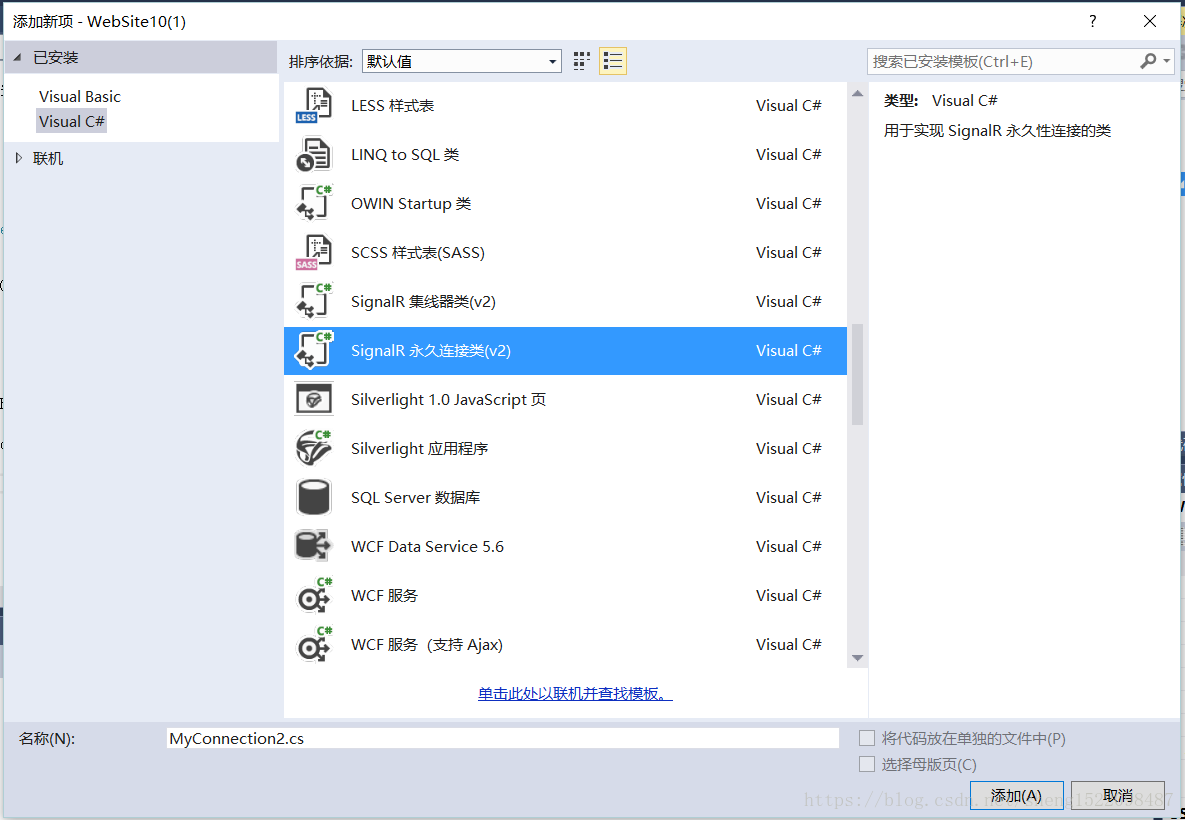
1.新建persistence connection类
using System;
using System.Collections.Generic;
using System.Linq;
using System.Threading.Tasks;
using System.Web;
using Microsoft.AspNet.SignalR;

public class MyConnection1 : PersistentConnection
{
    protected override Task OnConnected(IRequest request, string connectionId)
    {
        return Connection.Send(connectionId, "Welcome!");
    }

    protected override Task OnReceived(IRequest request, string connectionId, string data)
    {
        return Connection.Broadcast(data);
    }
}
2.新建owin startup路由文件(startup.cs)
using System;
using System.Threading.Tasks;
using Microsoft.Owin;
using Owin;

[assembly: OwinStartup(typeof(Startup))]

public class Startup
{
    public void Configuration(IAppBuilder app)
    {
        app.MapSignalR<MyConnection1>("/echo");
    }
}
3.前台js交互
引入相关js文件,在JavaScript.js中进行编程,与后台signalr服务端交互。
<script src="Scripts/jquery-1.6.4.js"></script>
<script src="Scripts/jquery.signalR-2.3.0.js"></script>
<!DOCTYPE html>
<html xmlns="http://www.w3.org/1999/xhtml">
<head>
    <meta http-equiv="Content-Type" content="text/html; charset=utf-8" />

    <script src="https://img.hcharts.cn/jquery/jquery-1.8.3.min.js"></script>
    <script src="https://img.hcharts.cn/highstock/highstock.js"></script>
    <script src="https://img.hcharts.cn/highcharts/modules/exporting.js"></script>
    <script src="https://img.hcharts.cn/highcharts-plugins/highcharts-zh_CN.js"></script>
    <script src="https://img.hcharts.cn/highcharts/themes/grid-light.js"></script>
    <script src="Scripts/moment.js"></script>
    <title>
        Signalr Test
    </title>

</head>
<body>
    <script src="Scripts/jquery-1.6.4.js"></script>
    <script src="Scripts/jquery.signalR-2.3.0.js"></script>
    <div id="main" style="width: 1500px;height:400px;"></div>
    <script src="JavaScript.js"></script>
</body>
</html>
4.编写交互js和后台调度数据
$.connection('/echo')与signalr服务端进行连接,$.receive()接收来自服务端推送。我的思路是当后台接收数据变化时,推送消息给客户端,当$.receive()接收到信息时,直接执行getdata(),刷新数据。
Highcharts.setOptions({
    global: {
        useUTC: true
    }
});
var chart = null;
var names = [];
var getTime8h = new Date('2015-01-01 08:00:00').getTime() - new Date('2015-01-01 00:00:00').getTime();
// Create the chart
$(document).ready(function () {
    seriesOptions = [];
    chart = new Highcharts.stockChart({

        chart: {
            renderTo: 'main',
            type: 'spline',
        },
        rangeSelector: {
            buttons: [{
                type: 'minute',
                count: 5,
                text: '5分钟',
            },
                {
                    type: 'hour',
                    count: 1,
                    text: '小时'
                }, {
                    type: 'day',
                    count: 1,
                    text: '一天'
                }, {
                    type: 'all',
                    text: '所有'
                }],
            inputEnabled: false,
            selected: 0,
        },
        //navigator: {
        //    adaptToUpdatedData: false,
        //    series: {
        //        data: datatim
        //    }
        //},
        title: {
            text: '曲线分析平台测试'
        },
        tooltip: {
            split: false,
            dateTimeLabelFormats: {
                millisecond: '%Y-%m-%d<br/> %H:%M:%S',
                second: '%Y-%m-%d<br/> %H:%M:%S',
                minute: '%Y-%m-%d<br/> %H:%M',
                hour: '%Y-%m-%d<br/> %H:%M',
                day: '%Y<br/> %m-%d',
                week: '%Y<br/> %m-%d',
                month: '%Y-%m',
                year: '%Y'
            },
        },
        exporting: {
            enabled: true,

        },
        //xAxis: {
        //    type: 'datetimee',
        //    data: time,
        //    tickPixelInterval: 150,
        //    maxZoom: 20 * 1000
        //}
        xAxis: {
            dateTimeLabelFormats: {
                millisecond: '%Y-%m-%d<br/> %H:%M:%S',
                second: '%Y-%m-%d<br/> %H:%M:%S',
                minute: '%Y-%m-%d<br/> %H:%M',
                hour: '%Y-%m-%d<br/> %H:%M',
                day: '%Y<br/> %m-%d',
                week: '%Y<br/> %m-%d',
                month: '%Y-%m',
                year: '%Y'
            },
        },
        yAxis: {
            minPadding: 0.2,
            maxPadding: 0.2,
            title: {
                text: 'sgrade',
                margin: 80
            }
        },
        series: [{
            name: 'demo',
            data: [],
        }]
    });
    var conn = $.connection('/echo');
    conn.start().done(function (data) {
        console.log("当前clientID=" + data.id);
    });
    //接受服务器的推送
    conn.received(function (data) {
        getdata();
        console.log("server返回的数据: " + data);
    });
    function getdata() {
        var datatim = [];
        var time = [];
        $.ajax({
            type: "post",
            async: false,            //异步请求(同步请求将会锁住浏览器,用户其他操作必须等待请求完成才可以执行)
            url: "Default.aspx?method=getdata",
            data: {},
            dataType: "json",        //返回数据形式为json
            success: function (data) {

                data.forEach(function (e, j) {
                    var a = new Array();
                   // console.log(e.datetimee);
                    a.push(Date.parse(e.datetimee) + getTime8h);
                    a.push(e.Sgrade);
                    datatim.push(a);
                });

                console.log(datatim);

                chart.series[0].setData(datatim);


            },
        })
    }

})5.编写后台数据获取不需要改变(参照C#曲线分析平台的制作(三,三层构架+echarts显示))
Default.aspx后台编写
using BLL;
using Newtonsoft.Json;
using System;
using System.Collections.Generic;
using System.Data;
using System.Linq;
using System.Web;
using System.Web.UI;
using System.Web.UI.WebControls;
using DAL;
using System.Data.SqlClient;
using System.Configuration;
using Microsoft.AspNet.SignalR.Client;
using Microsoft.AspNet.SignalR;


public partial class _Default : System.Web.UI.Page
{
    protected void Page_Load(object sender, EventArgs e)
    {
        string method = Request.QueryString["method"];
        if (!string.IsNullOrEmpty(method))
        {
            if (method == "getdata")
            {
                    data();

            }
        }
    }


    public void data()
    {
        DataTable dt = new DataTable();
        dt = UserManage.returntable();
        // lists = new List<object>();
        //  lists = UserManage.returnlist();

        object JSONObj = (Object)JsonConvert.SerializeObject(dt);
        Response.Write(JSONObj);
        //  一定要加,不然前端接收失败
        Response.End();

    }
}
3.windows服务编写监控sqldependency变化:
先前考虑的是直接使用console后台监控,但考虑到其容易被人误操作给直接关闭,故而寻求更稳定的windows服务。
新建windows服务->编写services.cs文件:
改写网友提供的博客,然后在sqldependency触发变化事件时,添加相关signalr连接和数据发送(以用来触发前端客户端触发getdata())
var connection = new Connection("http://localhost:4454/echo");
connection.Start().Wait();
connection.Send("hello").Wait();
using Microsoft.AspNet.SignalR.Client;
using System;
using System.Collections.Generic;
using System.ComponentModel;
using System.Data;
using System.Data.SqlClient;
using System.Diagnostics;
using System.IO;
using System.Linq;
using System.ServiceProcess;
using System.Text;
using System.Threading.Tasks;

namespace WindowsService1
{
    public partial class Service1 : ServiceBase
    {
        string _connStr = @"Server=.;Database=SanCengDemo;Trusted_Connection=True";
        public Service1()
        {
            InitializeComponent();
        }

        protected override void OnStart(string[] args)
        {


            SqlDependency.Start(_connStr);//传入连接字符串,启动基于数据库的监听
            UpdateGrid();
        }

        private void UpdateGrid()
        {
            string _connStr = @"Server=.;Database=SanCengDemo;Trusted_Connection=True";
            using (SqlConnection connection = new SqlConnection(_connStr))
            {
                //依赖是基于某一张表的,而且查询语句只能是简单查询语句,不能带top或*,同时必须指定所有者,即类似[dbo].[],如果where条件存在datetime类型,就会导致一直触发onChange事件
                using (SqlCommand command = new SqlCommand("select Sid,Sgrade,[DateTimee] From [dbo].[Student]", connection))
                {
                    command.CommandType = CommandType.Text;
                    connection.Open();
                    SqlDependency dependency = new SqlDependency(command);
                    dependency.OnChange += new OnChangeEventHandler(dependency_OnChange);

                    SqlDataReader sdr = command.ExecuteReader();
                    Console.WriteLine();
                    while (sdr.Read())
                    {
                        Console.WriteLine("Sid:{0}\tSgrade:{1}\tDateTimee:{2}", sdr["Sid"].ToString(), sdr["Sgrade"].ToString(),

 sdr["DateTimee"].ToString());
                    }
                    sdr.Close();
                }
            }
        }

        private void dependency_OnChange(object sender, SqlNotificationEventArgs e)
        {
            SqlDependency dependency = sender as SqlDependency;
            dependency.OnChange -= dependency_OnChange;
            if (e.Info != SqlNotificationInfo.Invalid)
            {
                var connection = new Connection("http://localhost:4454/echo");
                connection.Start().Wait();
                connection.Send("hello").Wait();
                UpdateGrid();//此处需重复注册<span style="font-family: Arial, Helvetica, sans-serif;">SqlDependency,每次注册只执行一次,SqlDependency.id可用用于验证注册唯一 编号
            }
        }

        protected override void OnStop()
        {
           // this.timer1.Enabled = false;
        }
    }
}