Matlab 画柱状图
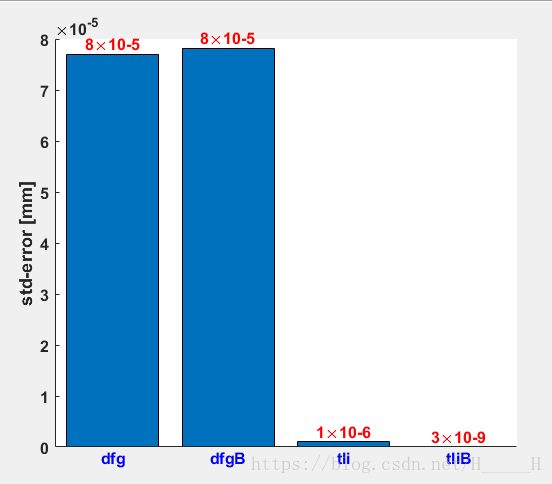
errorlist=[std_dfg,std_dfgB,std_tli,std_tliB];
figure('Name','std of reconstruction error' ...
    ,'position',[100 200 1200 500]...
    );  %position以屏幕左下角为原点,不是右上角
bar(errorlist);
colormap(lines(3));
hold on;
method_str={'dfg','dfgB','tli','tliB'};
for num=1:numel(method_str)
    str=num2str(errorlist(num),'%.e');
    str=[strrep(str,'e-0','\times10{-') '}'];%字符串替代
    text(num,errorlist(num),str...
        ,'VerticalAlignment','Bottom' ...
        ,'HorizontalAlignment','Center'...
        ,'FontSize', 12 ...
        ,'FontWeight', 'Bold' ...
        ,'Color', 'r' ...
        );
    text(num,0,method_str(num)...
        ,'VerticalAlignment','top' ...
        ,'HorizontalAlignment','Center'...
        ,'FontSize', 12 ...
        ,'FontWeight', 'Bold' ...
        ,'Color', 'b' ...
        );

end;

box off;
set(gca,'XTick', [] ...
    ,'FontSize', 12 ...
    ,'FontWeight', 'Bold' ...
    );
ylabel('std-error [mm]');- 结果图