在评价一个检测模型时通常需要绘制出其 ROC 曲线或 PR 曲线。本文利用 Python 实现了 ROC 和 PR 曲线的绘制,在 draw_curves 函数中读取 .txt 文件即可一次性绘制出两条曲线并输出 AUC 和 mAP 值,适用于目标检测任务,例如人脸检测。获取代码请戳 GitHub 链接。
1 流程
为目标检测任务绘制曲线的流程如下:
- 以检测结果中每一个的 boundingbox 为对象(记检测出的 boundingbox 的个数为 M),去匹配该张图片里的每一个 groundtruth boundingbox,计算出交并比 (IoU),并保留其中最大的值—— maxIoU,同时记录下 confidence 分数。就得到了一个数组—— maxIoU_confidence,其长度等于 M,宽度为 2,再按照 confidence 从大到小排序。
- 设置一个阈值,一般取 0.5。当 maxIoU 大于阈值时,记为 1,即 true positive;当 maxIoU 小于阈值时,记为 0,即 false positve。这样就得到了 tf_confidence,其尺寸不变,与 maxIoU_confidence 相同。
- 从上到下截取数组 tf_confidence 的前 1,2,3,…,M 行,每次截取都得到一个子数组,子数组中 1 的个数即为 tp,0 的个数即为 fp,查全率 recall = tp / (groundtruth boundingbox 的个数),查准率 precision (或 TPR) = tp / (tp + fp)。每次截取得到一个点,这样就一共得到 M 个点。以 fp 为横坐标,TPR 为纵坐标绘制出 ROC 曲线;以 recall 为横坐标,precision 为纵坐标绘制出 PR 曲线。
2 输入
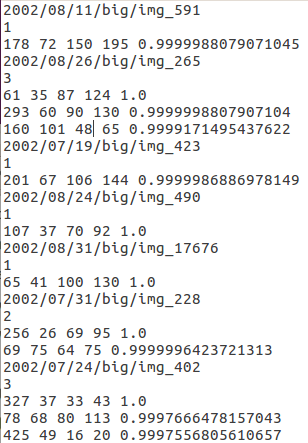
本程序需要读入两个分别记录检测结果和标准答案的 .txt 文件,记录格式与 FDDB 的要求相同,即
...
image name i
number of faces in this image =im
face i1
face i2
...
face im
...
当检测框为矩形时,
为左上角x 左上角y 宽 高 分数
例如
(当检测框为椭圆时,格式需要为长轴半径 短轴半径 角度 中心点x 中心点y 分数)
3 实现
本程序通过 draw_curves 函数实现曲线的绘制,输入为两个 .txt 文件和可选的 IoU 设定阈值,代码如下:
def draw_curves(resultsfile, groundtruthfile, show_images = False, threshold = 0.5):
    """
    读取包含检测结果和标准答案的两个.txt文件, 画出ROC曲线和PR曲线
    :param resultsfile: 包含检测结果的.txt文件
    :param groundtruthfile: 包含标准答案的.txt文件
    :param show_images: 是否显示图片, 若需可视化, 需修改Calculate.match中的代码, 找到存放图片的路径
    :param threshold: IoU阈值
    """
    maxiou_confidence, num_detectedbox, num_groundtruthbox = match(resultsfile, groundtruthfile, show_images)
    tf_confidence = thres(maxiou_confidence, threshold)
    plot(tf_confidence, num_groundtruthbox)


draw_curves("results.txt", "ellipseList.txt")
其中函数match, thres, plot 实现的功能分别对应流程中的 1, 2, 3 点,代码实现见 3.1 至 3.3。3.4 至 3.6 节介绍了其他功能模块函数。
3.1 匹配
def match(resultsfile, groundtruthfile, show_images):
    """
    匹配检测框和标注框, 为每一个检测框得到一个最大交并比
    :param resultsfile: 包含检测结果的.txt文件
    :param groundtruthfile: 包含标准答案的.txt文件
    :param show_images: 是否显示图片
    :return maxiou_confidence: np.array, 存放所有检测框对应的最大交并比和置信度
    :return num_detectedbox: int, 检测框的总数
    :return num_groundtruthbox: int, 标注框的总数
    """
    results, num_detectedbox = load(resultsfile)
    groundtruth, num_groundtruthbox = load(groundtruthfile)

    assert len(results) == len(groundtruth), "数量不匹配: 标准答案中图片数量为%d, 而检测结果中图片数量为%d" % (
    len(groundtruth), len(results))

    maxiou_confidence = np.array([])

    for i in range(len(results)):

        print(results[i][0])

        if show_images: # 若需可视化
            fname = './' + results[i][0] + '.jpg' # 若需可视化, 修改这里为存放图片的路径
            image = cv2.imread(fname)

        for j in range(2, len(results[i])): # 对于一张图片中的每一个检测框

            iou_array = np.array([])
            detectedbox = results[i][j]
            confidence = detectedbox[-1]

            if show_images: # 若需可视化
                x_min, y_min = int(detectedbox[0]), int(detectedbox[1])
                x_max = int(detectedbox[0] + detectedbox[2])
                y_max = int(detectedbox[1] + detectedbox[3])
                cv2.rectangle(image, (x_min, y_min), (x_max, y_max), (255, 0, 0), 2)

            for k in range(2, len(groundtruth[i])): # 去匹配这张图片中的每一个标注框
                groundtruthbox = groundtruth[i][k]
                iou = cal_IoU(detectedbox, groundtruthbox)
                iou_array = np.append(iou_array, iou) # 得到一个交并比的数组

                if show_images: # 若需可视化
                    x_min, y_min = int(groundtruthbox[0]), int(groundtruthbox[1])
                    x_max = int(groundtruthbox[0] + groundtruthbox[2])
                    y_max = int(groundtruthbox[1] + groundtruthbox[3])
                    cv2.rectangle(image, (x_min, y_min), (x_max, y_max), (0, 255, 0), 2)

            maxiou = np.max(iou_array) #最大交并比
            maxiou_confidence = np.append(maxiou_confidence, [maxiou, confidence])

        if show_images: # 若需可视化
            cv2.imshow("Image",image)
            cv2.waitKey()

    maxiou_confidence = maxiou_confidence.reshape(-1, 2)
    maxiou_confidence = maxiou_confidence[np.argsort(-maxiou_confidence[:, 1])] # 按置信度从大到小排序

    return maxiou_confidence, num_detectedbox, num_groundtruthbox
3.2 阈值划分
def thres(maxiou_confidence, threshold = 0.5):
    """
    将大于阈值的最大交并比记为1, 反正记为0
    :param maxiou_confidence: np.array, 存放所有检测框对应的最大交并比和置信度
    :param threshold: 阈值
    :return tf_confidence: np.array, 存放所有检测框对应的tp或fp和置信度
    """
    maxious = maxiou_confidence[:, 0]
    confidences = maxiou_confidence[:, 1]
    true_or_flase = (maxious > threshold)
    tf_confidence = np.array([true_or_flase, confidences])
    tf_confidence = tf_confidence.T
    tf_confidence = tf_confidence[np.argsort(-tf_confidence[:, 1])]
    return tf_confidence
3.3 画图
def plot(tf_confidence, num_groundtruthbox):
    """
    从上到下截取tf_confidence, 计算并画图
    :param tf_confidence: np.array, 存放所有检测框对应的tp或fp和置信度
    :param num_groundtruthbox: int, 标注框的总数
    """
    fp_list = []
    recall_list = []
    precision_list = []
    auc = 0
    mAP = 0
    for num in range(len(tf_confidence)):
        arr = tf_confidence[:(num + 1), 0] # 截取, 注意要加1
        tp = np.sum(arr)
        fp = np.sum(arr == 0)
        recall = tp / num_groundtruthbox
        precision = tp / (tp + fp)
        auc = auc + recall
        mAP = mAP + precision

        fp_list.append(fp)
        recall_list.append(recall)
        precision_list.append(precision)

    auc = auc / len(fp_list)
    mAP = mAP * max(recall_list) / len(recall_list)

    plt.figure()
    plt.title('ROC')
    plt.xlabel('False Positives')
    plt.ylabel('True Positive rate')
    plt.ylim(0, 1)
    plt.plot(fp_list, recall_list, label = 'AUC: ' + str(auc))
    plt.legend()

    plt.figure()
    plt.title('Precision-Recall')
    plt.xlabel('Recall')
    plt.ylabel('Precision')
    plt.axis([0, 1, 0, 1])
    plt.plot(recall_list, precision_list, label = 'mAP: ' + str(mAP))
    plt.legend()

    plt.show()
3.4 将椭圆检测框转化为矩形框
常用的检测框样式有椭圆框和矩形框两种,FDDB 的标准答案就是用椭圆框标注的。为了计算交并比,编写了将椭圆框转换为矩形框的函数,这里只是一个近似,有待寻找更好的转换方法或者计算椭圆和矩形交并比的方法。
def ellipse_to_rect(ellipse):
    """
    将椭圆框转换为水平竖直的矩形框
    :param ellipse: list, [major_axis_radius minor_axis_radius angle center_x center_y, score]
    :return rect: list, [leftx, topy, width, height, score]
    """
    major_axis_radius, minor_axis_radius, angle, center_x, center_y, score = ellipse
    leftx = center_x - minor_axis_radius
    topy = center_y - major_axis_radius
    width = 2 * minor_axis_radius
    height = 2 * major_axis_radius
    rect = [leftx, topy, width, height, score]
    return rect
3.5 计算交并比
def cal_IoU(detectedbox, groundtruthbox):
    """
    计算两个水平竖直的矩形的交并比
    :param detectedbox: list, [leftx_det, topy_det, width_det, height_det, confidence]
    :param groundtruthbox: list, [leftx_gt, topy_gt, width_gt, height_gt, 1]
    :return iou: 交并比
    """
    leftx_det, topy_det, width_det, height_det, _ = detectedbox
    leftx_gt, topy_gt, width_gt, height_gt, _ = groundtruthbox

    centerx_det = leftx_det + width_det / 2
    centerx_gt = leftx_gt + width_gt / 2
    centery_det = topy_det + height_det / 2
    centery_gt = topy_gt + height_gt / 2

    distancex = abs(centerx_det - centerx_gt) - (width_det + width_gt) / 2
    distancey = abs(centery_det - centery_gt) - (height_det + height_gt) / 2

    if distancex <= 0 and distancey <= 0:
        intersection = distancex * distancey
        union = width_det * height_det + width_gt * height_gt - intersection
        iou = intersection / union
        print(iou)
        return iou
    else:
        return 0
3.6 读取 .txt 文件
def load(txtfile):
    '''
    读取检测结果或 groundtruth 的文档, 若为椭圆坐标, 转换为矩形坐标
    :param txtfile: 读入的.txt文件, 格式要求与FDDB相同
    :return imagelist: list, 每张图片的信息单独为一行, 第一列是图片名称, 第二列是人脸个数, 后面的列均为列表, 包含4个矩形坐标和1个分数
    :return num_allboxes: int, 矩形框的总个数
    '''
    imagelist = [] # 包含所有图片的信息的列表

    txtfile = open(txtfile, 'r')
    lines = txtfile.readlines() # 一次性全部读取, 得到一个list

    num_allboxes = 0
    i = 0
    while i < len(lines): # 在lines中循环一遍
        image = [] # 包含一张图片信息的列表
        image.append(lines[i].strip()) # 去掉首尾的空格和换行符, 向image中写入图片名称
        num_faces = int(lines[i + 1])
        num_allboxes = num_allboxes + num_faces
        image.append(num_faces) # 向image中写入人脸个数

        if num_faces > 0:
            for num in range(num_faces):
                boundingbox = lines[i + 2 + num].strip() # 去掉首尾的空格和换行符
                boundingbox = boundingbox.split() # 按中间的空格分割成多个元素
                boundingbox = list(map(float, boundingbox)) # 转换成浮点数列表

                if len(boundingbox) == 6: # 如果是椭圆坐标
                    boundingbox = ellipse_to_rect(boundingbox) # 则转换为矩形坐标

                image.append(boundingbox) # 向image中写入包含矩形坐标和分数的浮点数列表

        imagelist.append(image) # 向imagelist中写入一张图片的信息

        i = i + num_faces + 2 # 增加index至下张图片开始的行数

    txtfile.close()

    return imagelist, num_allboxes
4 输出结果
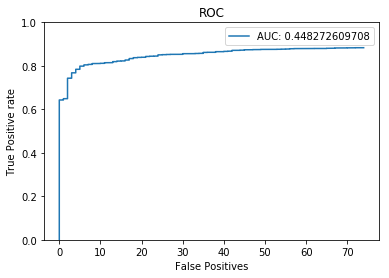
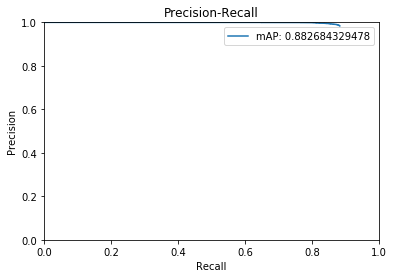
笔者利用此程序在 FDDB 上测试了一个人脸检测模型,绘制出的 ROC 曲线和 PR 曲线如图所示。可以看出此模型误检率很低,但召回率不够高。
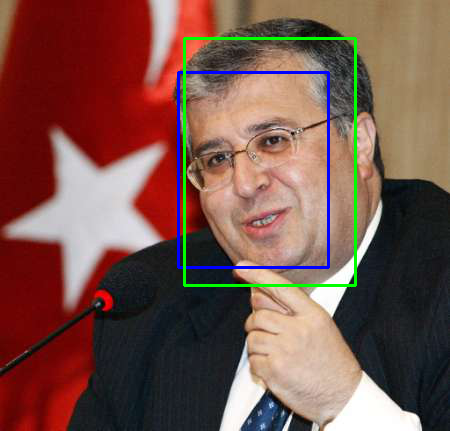
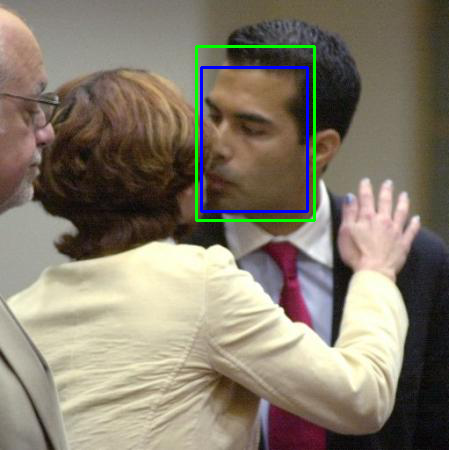
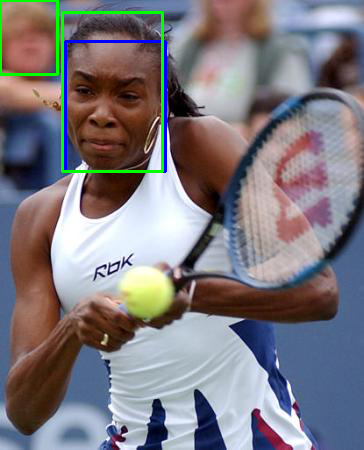
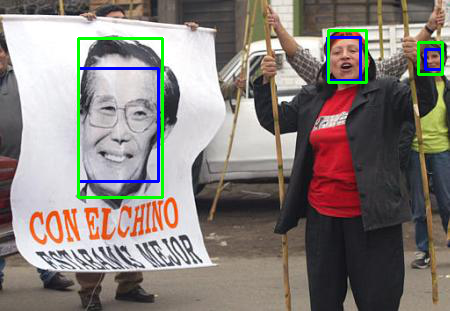
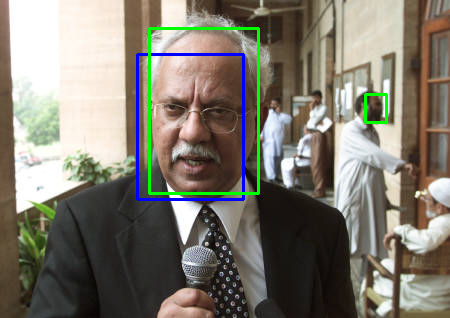
在编程阶段,笔者通过可视化输出检查代码是否有逻辑错误 。以下是几张检测结果。绿色框为由椭圆框转换过来的 groundtruth 标注框,蓝色框为检测结果 。