2D绘图:
首先终端运行 gnuplot,启动gnuplot.
在gnuplot的终端中画一个最简单的图:
plot sin(x) //plot是2D绘图的命令,3D绘图用splot可以看到下图
如果想运行一个画图脚本文件(方便测试),可以在gnuplot终端中运行:
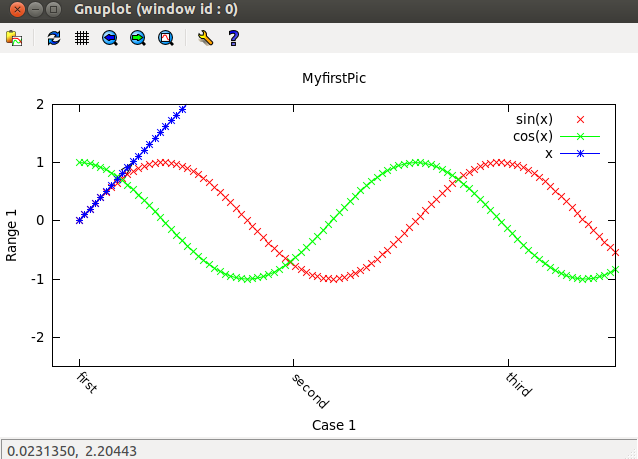
load 'file_name'下面拿一个稍微复杂点的例子来说:
代码如下:
#取消设置用unset,如取消xlabel,使用命令 unset xlabel

set xrange [0:10]   #设置x轴的范围
set yrange [-2:2]  #设置y轴的范围

set xtics 0,4,8     #设置x轴的坐标轴刻度,从0到8,以4为增加单位
set xtics ('first' 0, 'second' 4, 'third' 8) #设置x坐标轴刻度的别名
set xtics rotate by -45     #设置名称显示的角度,旋转-45度,如果不加度数,相当于旋转90度,如果是45度,会将刻度别名显示到图中
                            #如果希望正向旋转,需要加offset
set ytics -2,1,2

set title "MyfirstPic"  #设置图片标题
set xlabel "Case 1"     #设置x轴的标签名字
set ylabel "Range 1"

set offset 0.5,0,0,0.5     #设置x轴和y轴的偏移,可以在左下角留出空隙,四个参数<left>,<right>,<top>,<bottom>

set key      #设置显示key

set arrow 3 from 0,0 to 1,1   #设置一条从(0,0)到(1,1)的箭头,show arrow命令显示箭头的情况。

plot sin(x) with points pointtype 2     #points 和linespoints图形其实是有区别的,linespoints中间是有线连着的,从key中也是可以看出来的。
replot cos(x) with linespoints pointtype 2  #replot是将另外一图画到上面一个plot所在的界面中
replot x with linespoints linetype 3 #linetype可简写为lt,with可简写为w,pointtype可简写为pt参考文章:
1. http://blog.csdn.net/liyuanbhu/article/details/8502383
2. gnuplot 4.6手册

