版权声明:本文为博主原创文章,未经博主允许不得转载。 https://blog.csdn.net/lanchunhui/article/details/83312761
1. plt.step() 与 plt.bar()
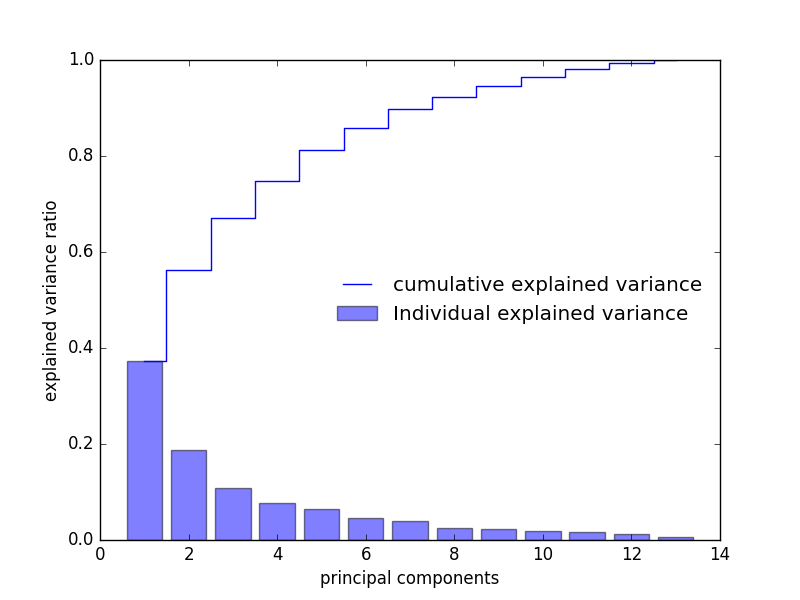
- plt.bar(range(1, len(x)), x, alpha=.4, align=‘center’, label=‘individual’)
- plt.step(range(1, 14), np.cumsum(x), where=‘mid’, label=‘cumsum’)
x = [ 4.8923083   2.46635032  1.42809973  1.01233462  0.84906459  0.60181514  0.52251546  0.08414846  0.33051429  0.29595018  0.16831254  0.21432212  0.2399553 ]
tot = sum(x)
x = [i/tol for i in x]
plt.bar(range(1, len(x)), x, alpha=.4, align='center', label='individual')
plt.step(range(1, len(x)), np.cumsum(x), where='mid', label='cumsum')
plt.legend(loc='best', frameon=False)
plt.show()
2. 柱状图
plt.bar(np.array(x)-.4, y)
		# 在一切默认的情况下,减去0.4是平移每一个条形柱的位置
		# 可见每一个条形柱的宽度为0.8
- 参数
- yerr
3. plt.hist(histtype=’’)
histtype={‘bar’, ‘barstacked’, ‘step’, ‘stepfilled’};
optional
default为’bar’
histtype=‘step’; 似乎感觉上更道地一点;
4. errorbar
plt.errorbar(x, y, xerr, yerr, fmt='ok', ecolor='gray', alpha=.5)
							# fmt='ok',表示的是(x, y)这一坐标位置的显示形式,实心(o)圆点,颜色是黑色
							# ecolor='gray',表示错误线的颜色
plt.errorbar(x, y, e, fmt='.k', ecolor='gray', alpha=.4)