1.使用时间戳
import matplotlib
import matplotlib.pyplot as plt
import numpy as np
import datetime
# create data
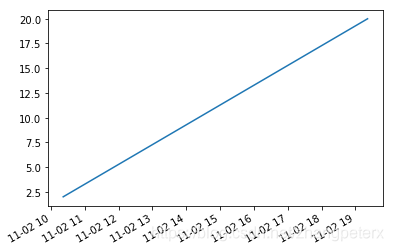
y = [ 2,4,6,8,10,12,14,16,18,20 ]
x = [datetime.datetime.now() + datetime.timedelta(hours=i) for i in range(len(y))]
# plot
plt.plot(x,y)
plt.gcf().autofmt_xdate()
plt.show()
效果如下:
2.使用DateFormatter
实例:
from datetime import datetime
import matplotlib.dates as mdates
import matplotlib.pyplot as plt
dates = ['01/02/1999', '01/03/1999', '01/04/1999']
xs = [datetime.strptime(d, '%m/%d/%Y').date() for d in dates]
ys = range(len(xs))
plt.gca().xaxis.set_major_formatter(mdates.DateFormatter('%m/%d/%Y'))
plt.gca().xaxis.set_major_locator(mdates.DayLocator())
# Plot
plt.plot(xs, ys)
plt.gcf().autofmt_xdate()
plt.show()