功能类型
1 功能特点
TeeChart Pro功能是一个系列,几乎可以是任何系列类型,应用代数函数,数据源是另一个图表系列。 所有函数都派生自Teefunction类并继承TeeFunction的Period属性。
TeeChart Pro提供以下预定义功能列表:
| 功能类型 | 投入数量 | 描述 |
| 标准 | ||
| Add | Unlimited | 绘制输入总和 |
| Subtract | Unlimited | 绘图的输入值按包含的降序减去 |
| Multiply | Unlimited | 乘法函数绘制输入值的乘积 |
| Divide | Unlimited | 分割函数绘制输入按包含的降序划分 |
| High | Unlimited | 高功能绘制高输入点 |
| Low | Unlimited | 低功能绘制低输入点 |
| Average | Unlimited | 平均函数将计算每组Period点的平均值 |
| Y=F(X) | None | 绘制用户定义的函数 |
| Count | Unlimited | 计算图表中的系列点数 |
| Extended | ||
| Smoothing | 1 | 创建了一条平滑的线,连接来自给定源系列的点 |
| Exponential Average | 1 | 基于权重的指数平均值 |
| Standard Deviation | 1 | 映射每组Period点的标准偏差(或完全标准差) |
| Root Mean Square | 1 | (RMS) Result = Sqrt( Sum( Square(Value) ) ) / NumValues ) |
| Cross Points | Unlimited | 两个Line系列相互交叉的亮点 |
| Peformance | 1 | 从一个系列点到下一个系列点的百分比变化 |
| Curve Fitting | 1 | 使用TypeFitting公式通过数据输入绘制曲线 |
| Trend | 1 | 通过输入系列点绘制最佳趋势线 |
| Exponential Trend | 1 | 指数加权的趋势 |
| Cumulative | Unlimited | 根据输入的累积值构造一条线 |
| Financial | ||
| ADX | 1 | 金融功能,平均方向变化 |
| R.S.I. | 1 | RSI = 100.0 - ( 100.0 / ( 1.0 + Abs( Ups / Downs ) ) ) |
| Moving Average | 1 | 移动平均线功能将计算每组周期点的简单或加权平均值 |
| Exponential Moving Average | 1 | 使用以下公式: FP = 2 / ( Period + 1 ) |
| Momentum | 1 | 每个Y值是当前点的Y值减去最后一个Period点的Y值 |
| Momentum Division | 1 | 与先前'第n'值相比的价值比率 |
| MACD | 1 | 财务功能。移动平均收敛分歧 |
| Stochastic | 1 | 财务功能。计算给定时期内的最高值和最低值 |
| Bollinger | 1 | 财务功能。使用移动平均线(可能是指数)和标准差 |
| Compression | 1 | 计算日期时间段内源系列的最高值和最低值 |
| Closed Location Value | 1 | CLV = ( (Close-Low)-(High-Close))/(High-Low) |
| On Balance Volume | 1 | 对于OHLC系列中的每个点,将收盘价与开盘价进行比较。如果Close更高,则添加该点的Volume值。如果关闭较低,则降低音量值。 |
| Commodity Channel Index | 1 | 财务指标用于识别商品的周期性转向 |
| Volume Oscillator | 1 | 计算两个指数移动平均线之间的差异(a - b) |
多种函数类型仅支持一个输入系列。但是,可以链接链接函数,例如,将图表中多个系列的平均值创建为平均函数系列,然后使用平均函数作为趋势函数的输入来标识平均值的趋势。
2 添加功能
使用图表编辑器,在“第一个图表”页面上,选择“Add”按钮,就像将新系列添加到图表一样。在TeeChart Gallery中,选择Functions选项卡以选择所需的功能。每个功能都显示为一个系列,您可以稍后通过选择第一个图表页面上的更改按钮来更改与该功能关联的系列类型。之后,在函数系列的“Datasource”页面上可以轻松更改函数定义。在这里,同样容易,您可以将已添加到Chart的正常Series的定义更改为Function的定义(Function实际上是数据源的定义,而不是Series Type的定义)。
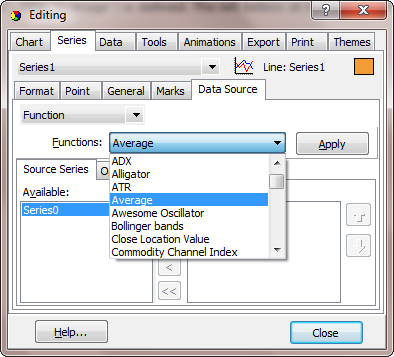
下图显示了编辑函数时的“Datasource”页面。线系列(名称“Series1”,标题“平均”)被定义。数据源页面底部的左侧列表框显示了可用于输入的图表中的其他系列(此处为“Series0”)。
假设我们从一个完全空的Chart开始,这里是代码中用于构建简单的Series-Function相关Chart的步骤。
With TChart1
  'Add 2 data Series
  .AddSeries scBar
  .AddSeries scBar
  ' Populate them with data (here random)
  .Series(0).FillSampleValues 10
  .Series(1).FillSampleValues 10
  ' Add a series to be used for an Average Function
  .AddSeries scLine
  'Define the Function Type for the new Series
  .Series(2).SetFunction tfAverage
  'Define the Datasource for the new Function Series
  'Datasource accepts the Series titles of the other 2 Series
  .Series(2).DataSource = "Series0,Series1"
   '    *Note - When populating your input Series manually you will need to
   '    use the Checkdatasource method
   '    - See the section entitled 'Defining a Datasource'
  'Change the Period of the Function so that it groups averages
  'every 2 Points
  .Series(2).FunctionType.Period = 2
End With
我们可以添加另一个函数来告诉我们有关前一个函数的信息
With TChart1
  'Add another Series to be used for a 2nd Function
  .AddSeries scLine
  'Define the Function Type for the new Series
  .Series(3).SetFunction tfHigh
  'Define the Datasource for the new Function Series
  'Use the existing Function (Series2) as input
  .Series(3).DataSource = "Series2"
  'Leave the Period at default 0 (No Period set) to draw
  'A line at Highest of all points of the Average Function
End With