最近恶补后端技术,发现还是很多不懂,一直写业务逻辑容易迷失,也没有成长。自己做系统,也习惯用自己已知的知识来解决,以后应该多点调研,学到更多的东西应用起来。
先学一个新的性能分析命令。
 1 NAME
 2        perf - Performance analysis tools for Linux
 3
 4 SYNOPSIS
 5        perf [--version] [--help] COMMAND [ARGS]
 6
 7 DESCRIPTION
 8        Performance counters for Linux are a new kernel-based subsystem that provide a framework for all things performance analysis. It covers hardware level (CPU/PMU, Performance Monitoring Unit) features and software features
 9        (software counters, tracepoints) as well.
10
11 SEE ALSO
12        perf-stat(1), perf-top(1), perf-record(1), perf-report(1), perf-list(1)
perf record子命令:
 1 NAME
 2        perf-record - Run a command and record its profile into perf.data
 3
 4 SYNOPSIS
 5        perf record [-e <EVENT> | --event=EVENT] [-l] [-a] <command>
 6        perf record [-e <EVENT> | --event=EVENT] [-l] [-a] -- <command> [<options>]
 7
 8 DESCRIPTION
 9        This command runs a command and gathers a performance counter profile from it, into perf.data - without displaying anything.
10
11        This file can then be inspected later on, using perf report.
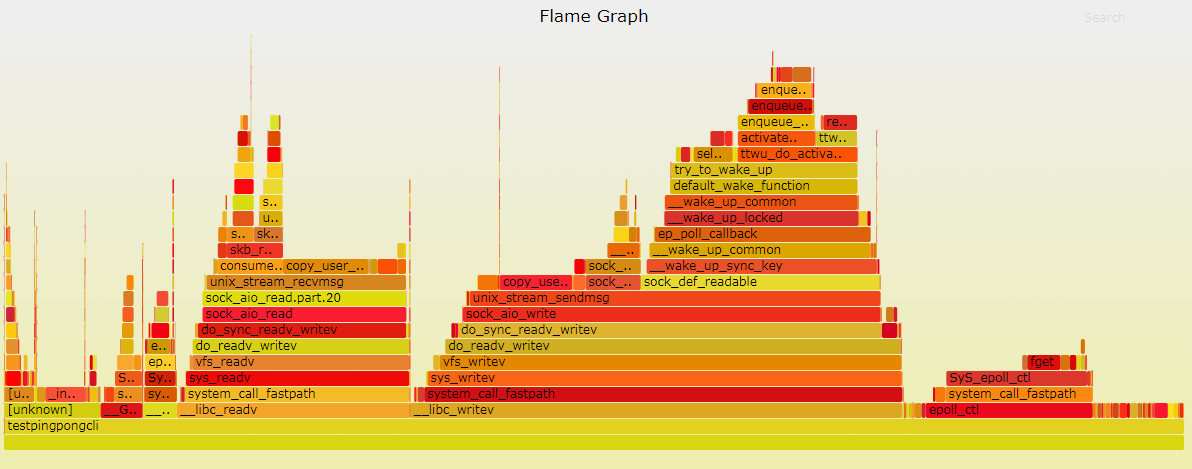
火焰图是基于 perf 结果产生的 SVG 图片,用来展示 CPU 的调用栈。
y 轴表示调用栈,每一层都是一个函数。调用栈越深,火焰就越高,顶部就是正在执行的函数,下方都是它的父函数。
x 轴表示抽样数,如果一个函数在 x 轴占据的宽度越宽,就表示它被抽到的次数多,即执行的时间长。注意,x 轴不代表时间,而是所有的调用栈合并后,按字母顺序排列的。
火焰图就是看顶层的哪个函数占据的宽度最大。只要有"平顶"(plateaus),就表示该函数可能存在性能问题。
颜色没有特殊含义,因为火焰图表示的是 CPU 的繁忙程度,所以一般选择暖色调。
http://www.ruanyifeng.com/blog/2017/09/flame-graph.html
生成工具:
https://github.com/brendangregg/FlameGraph
示例:
1 perf record -F 99 -p 181 -g -- sleep 60
2 perf script > out.perf
3 ./stackcollapse-perf.pl out.perf --all > out.folded
4 ./flamegraph.pl out.kern_folded > kernel.svg