option = {
  	backgroundColor: '#0e0b2a',
    tooltip : {
        formatter: "{a} <br/>{b} : {c}%"
    },
    toolbox: {
        show : true,
        feature : {
            mark : {show: true},
            restore : {show: true},
            saveAsImage : {show: true}
        }
    },
    series : [
        {
            name:'个性化仪表盘',
            type:'gauge',
            center : ['50%', '50%'],    // 默认全局居中
            radius : [0, '55%'],
            startAngle: -180,
            endAngle : -360,
            min: 0,                     // 最小值
            max: 1000,                   // 最大值
            precision: 0,               // 小数精度,默认为0,无小数点
            splitNumber: 5,             // 分割段数,默认为5
            axisLine: {            // 坐标轴线
                show: false,        // 默认显示,属性show控制显示与否
            },
            axisTick: {            // 坐标轴小标记
                show: false,        // 属性show控制显示与否,默认不显示
            },
            axisLabel: {           // 坐标轴文本标签,详见axis.axisLabel
                show: true,

                formatter: function(v){
                    switch (v+''){
                        case '0': return '0';
                        case '200': return '200';
                        case '400': return '400';
                        case '600': return '600';
                        case '800': return '800';
                        case '1000': return '1000';
                        default: return  "";
                    }
                },
                textStyle: {       // 其余属性默认使用全局文本样式,详见TEXTSTYLE
                    color: '#13b4eb',
                  	fontSize:12,
                }
            },
            splitLine: {           // 分隔线
                show: false,        // 默认显示,属性show控制显示与否
            },
            pointer : {
              	show:false,
            },
            title : {
                show : false,
            },
            detail : {
                show : false,
            },
            data:[]
        }, {
            name:'机组频率(HZ)',
            type:'gauge',
            center : ['50%', '50%'],    // 默认全局居中
            radius : [0, '28%'],
            startAngle: -180,
            endAngle : -360,
            min: 0,                     // 最小值
            max: 1000,                   // 最大值
            precision: 0,               // 小数精度,默认为0,无小数点
            splitNumber: 5,             // 分割段数,默认为5
            axisLine: {            // 坐标轴线
                show: true,        // 默认显示,属性show控制显示与否
                lineStyle: {       // 属性lineStyle控制线条样式
                    color: [[0.6, (function (){
                      var zrColor = require('zrender/tool/color');
                      return zrColor.getLinearGradient(
                         0,0,0, 1000,[[0, '#3740d5'],[0.3, '#13b4eb']])})(),]
                            ,[1, 'transparent']],
                    width: 12
                }
            },
            axisTick: {            // 坐标轴小标记
                show: false,        // 属性show控制显示与否,默认不显示
            },
            axisLabel: {           // 坐标轴文本标签,详见axis.axisLabel
                show: false,
            },
            splitLine: {           // 分隔线
                show: false,        // 默认显示,属性show控制显示与否
            },
            pointer : {
              	show:true,
                length : '40%',
                width : 4,
                color : '#13b4eb'
            },
            title : {
                show : false,
                offsetCenter: ['-65%', -10],       // x, y,单位px
                textStyle: {       // 其余属性默认使用全局文本样式,详见TEXTSTYLE
                    color: '#333',
                    fontSize : 15
                }
            },
            detail : {
                show : true,
                backgroundColor: 'rgba(0,0,0,0)',
                borderWidth: 0,
                borderColor: '#ccc',
                width: 100,
                height: 40,
                offsetCenter: ['0%', 8],       // x, y,单位px
                formatter:'{value}',
                textStyle: {       // 其余属性默认使用全局文本样式,详见TEXTSTYLE
                    color: '#13b4eb',
                    fontSize : 26
                }
            },
            data:[{value: 50.01, name: '频率'}]
        }
    ]
};

clearInterval(timeTicket);
timeTicket = setInterval(function (){
    option.series[1].data[0].value = (Math.random()*1000).toFixed(2) - 0;
    myChart.setOption(option, true);
},2000)
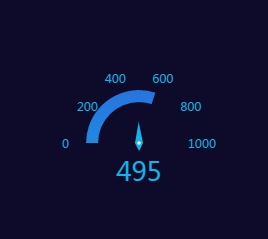
运行效果: