前言:记录一下如何在后台做好前台echarts需要的数据格式,这个代码写到一半然后由于我的项目数据库设计的查询一些数据太过麻烦,所以后来经讨论就没继续下去了,换了另一种比较简单展示,但是我想把这一半的功能记录一下。
效果: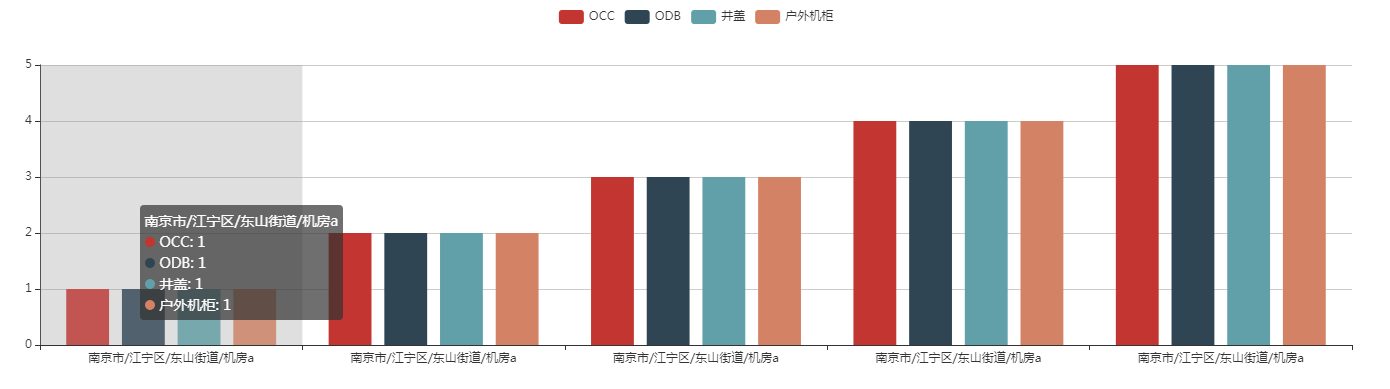
我的页面上面是可以选择一些区域,然后通过后台数据库查询展示这些区域的4个类型的数据,问题点在横坐标的数据它是一个递归展示这些区域的名字,由于我的数据库设计的原因这个数据并不好查。因为也是第一次使用echarts所以我觉得这种柱状图还是在横坐标比较固定的时候使用比较合适,比如横坐标是1-12月之类的。
emmm...看下后台代码和jsp页面实现吧。
实现:
首先是实体类,这里用于封装前台需要的数据格式:
import java.util.List;

/**
 * @ClassName: BarDTO
 * @Description: 统计模块数据对象
 * @author Kingram
 * @param <T>
 * @date 2018年12月10日
 *
 */
public class BarDTO<T> {

    private String name;
    private String type;
    private List<T> data;

    public String getName() {
        return name;
    }
    public void setName(String name) {
        this.name = name;
    }
    public String getType() {
        return type;
    }
    public void setType(String type) {
        this.type = type;
    }
    public List<T> getData() {
        return data;
    }
    public void setData(List<T> data) {
        this.data = data;
    }
}
然后是controller,直接使用@ResponseBody返回一个Map集合,这里我直接在controller里改成死数据了,毕竟怎么获得这些数据是SQL解决的事情。


@RequestMapping("getEquipmentData")
    @ResponseBody
    private Map<String,BarDTO<Integer>> getEquipmentData() {
        Map<String,BarDTO<Integer> > map = new HashMap<String,BarDTO<Integer>>();
        List<Integer> occList = new ArrayList<Integer>();
        occList.add(1);
        occList.add(2);
        occList.add(3);
        occList.add(4);
        occList.add(5);
        List<Integer> odbList = new ArrayList<Integer>();
        odbList.add(1);
        odbList.add(2);
        odbList.add(3);
        odbList.add(4);
        odbList.add(5);
        List<Integer> jgList = new ArrayList<Integer>();
        jgList.add(1);
        jgList.add(2);
        jgList.add(3);
        jgList.add(4);
        jgList.add(5);
        List<Integer> hwjgList = new ArrayList<Integer>();
        hwjgList.add(1);
        hwjgList.add(2);
        hwjgList.add(3);
        hwjgList.add(4);
        hwjgList.add(5);
        BarDTO<Integer> one = new BarDTO<>();
        one.setName("OCC");
        one.setType("bar");
        one.setData(occList);
        BarDTO<Integer> two = new BarDTO<>();
        two.setName("ODB");
        two.setType("bar");
        two.setData(odbList);
        BarDTO<Integer> three = new BarDTO<>();
        three.setName("井盖");
        three.setType("bar");
        three.setData(jgList);
        BarDTO<Integer> four = new BarDTO<>();
        four.setName("户外机柜");
        four.setType("bar");
        four.setData(hwjgList);

        map.put("OCC",one);
        map.put("ODB",two);
        map.put("JG",three);
        map.put("HWJG",four);
        return map;
    }
最后看下前台页面主要代码,这里使用的是ajax请求,拿到返回的数据,再生成柱状图,生成柱状图的方法我封装在了getEquipmentChart()方法里:
var occList = [];
var odbList = [];
var jgList = [];
var hwjgList = [];
$.ajax({
   type:"post",
   url:"****/getEquipmentData.do",
   async:false,
   success:function(res) {
     occList = res.OCC;
     odbList = res.ODB;
     jgList = res.JG;
     hwjgList = res.HWJG;
   },
   error:function() {}
});
getEquipmentChart(occList,odbList,jgList,hwjgList);
<script type="text/javascript">
        function getEquipmentChart(occList,odbList,jgList,hwjgList) {
            // 基于准备好的dom,初始化echarts实例
            var myChart = echarts.init(document.getElementById('container'));

            // 指定图表的配置项和数据
            var option = {
                tooltip: {
                trigger: 'axis',
                axisPointer: {
                    type: 'shadow'
                }
            },
              legend: {
                data: ['OCC', 'ODB', '井盖', '户外机柜']
            },
            xAxis: {
                type: 'category',
                data: ['南京市/江宁区/东山街道/机房a', '南京市/江宁区/东山街道/机房a', '南京市/江宁区/东山街道/机房a', '南京市/江宁区/东山街道/机房a', '南京市/江宁区/东山街道/机房a']
            },
            yAxis: {
                type: 'value'
            },
            series: [occList,odbList,jgList,hwjgList]
        };

            // 使用刚指定的配置项和数据显示图表。
            myChart.setOption(option);
        }
    </script>
其实主要就是在后台吧series里需要的数据格式做了个封装,xAxis里的data也是可以同样的方法从后台传过来,只不过在封装的时候注意一下即可。
emmm...记录一下吧。