numpy
array与 python list很像
1.第一种创建方式可用np.array方法将list转化成numpy array
import numpy as np
test_1=np.array([92, 94, 88, 91, 87])

my_list = [1, 2, 3, 4, 5, 6]
my_array = np.array(my_list)
第二种创建方式将csv导入成array
test_2 = np.genfromtxt('test_2.csv', delimiter=',')2.array相对于list的优越性
通过在阵列本身上执行操作,可以对阵列中的每个元素执行操作(例如添加)。
元素的加减乘除 幂 开方不需要for循环 可以直接进行
# With a list
l = [1, 2, 3, 4, 5]
l_plus_3 = []
for i in range(len(l)):
    l_plus_3.append(l[i] + 3)
# With an array
a = np.array(l)
a_plus_3 = a + 3
具有相同元素的array之间的相加可以直接进行,不是拼接,是每一个元素的相加这种,
import numpy as np

test_1 = np.array([92, 94, 88, 91, 87])
test_2 = np.array([79, 100, 86, 93, 91])
test_3 = np.array([87, 85, 72, 90, 92])
test_3_fixed = test_3 + 2
total_grade=test_1+test_2+test_3_fixed
final_grade=total_grade/3
print(final_grade)
同样不用遍历就能挑选出数组中的值
import numpy as np

porridge = np.array([79, 65, 50, 63, 56, 90, 85, 98, 79, 51])

cold = porridge[porridge < 60]

hot = porridge[porridge > 80]

just_right = porridge[(porridge > 60) & (porridge < 80)]

print(cold)
print(hot)
print(just_right)
3.具有相同元素个数的数组可以组成二维数组 从二维数组中取值类似一维
a =
np.array([[92, 94, 88, 91, 87],
          [79, 100, 86, 93, 91],
          [87, 85, 72, 90, 92]])

a[2,1]

#第一列
a[:,0]

#第一行
a[0,:]
4.function
1.mean
np.mean(array) 返回array的平均数
mean与逻辑运算 返回百分比 用mean而不是percentile
例如 np.mean(class_year>=2005) 返回数组中大于2005 的比例 相当于百分比
二维数组计算mean
axis=1 表示行平均数 axis=0表示列平均数
total_mean=np.mean(allergy_trials)
print(total_mean)

trial_mean=np.mean(allergy_trials,axis=1)
print(trial_mean)

patient_mean=np.mean(allergy_trials,axis=0)
print(patient_mean)
2.sort 可以找出异常值
np.sort(array) 返回一个排序好的array
3.Median 不受异常值影响
np.median(array) 返回array中位数 数组元素个数为偶数则取中间两个数平均数
4.percentile
一般来说一个array有五个节点0 25 50 75 100
np.percentile(array,40) 返回百分之40处的数 因为median只能返回50%处的数据 所以要有percentile
5.Standard Deviation 标准差 标准差越大说明数组与平均值相差越大
np.std(array) 返回标准差
6. np.random.normal(loc,scale,size) 随机返回一组正态分布的数组
loc: 等于mean平均数 scale:等于标准差 size:次数
正态分布一个标准差之内 也就是 mean+- std 一般是68% 两个标准差97% 三个99%
7.np.random.binomial(N,P,size) 返回一组二项分布的数组
二项分布能有效帮助认识到时间发生的概率
N:样本数量 P:成功概率 size:试验次数
例: 向日葵不开花的概率为10 ,问200株向日葵栽下去,20朵一下不开花的概率
experiments=np.random.binomial(200,0.1,5000)
prob=np.mean(experiments<20)
print(prob)
ceballos竞选市长问题 抽取的样本越大 越接近真实数值,当在10000人中抽取7000人调查时基本就是真实情况 中心极限定理
import codecademylib
import numpy as np
from matplotlib import pyplot as plt

survey_responses = ['Ceballos', 'Kerrigan', 'Ceballos', 'Ceballos', 'Ceballos','Kerrigan', 'Kerrigan', 'Ceballos', 'Ceballos', 'Ceballos',
'Kerrigan', 'Kerrigan', 'Ceballos', 'Ceballos', 'Kerrigan', 'Kerrigan', 'Ceballos', 'Ceballos', 'Kerrigan', 'Kerrigan', 'Kerrigan', 'Kerrigan', 'Kerrigan', 'Kerrigan', 'Ceballos', 'Ceballos', 'Ceballos', 'Ceballos', 'Ceballos', 'Ceballos',
'Kerrigan', 'Kerrigan', 'Ceballos', 'Ceballos', 'Ceballos', 'Kerrigan', 'Kerrigan', 'Ceballos', 'Ceballos', 'Kerrigan', 'Kerrigan', 'Ceballos', 'Ceballos', 'Kerrigan', 'Kerrigan', 'Kerrigan', 'Kerrigan', 'Kerrigan', 'Kerrigan', 'Ceballos',
'Kerrigan', 'Kerrigan', 'Ceballos', 'Ceballos', 'Ceballos', 'Kerrigan', 'Kerrigan', 'Ceballos', 'Ceballos', 'Kerrigan', 'Kerrigan', 'Ceballos', 'Ceballos', 'Kerrigan', 'Kerrigan', 'Kerrigan', 'Kerrigan', 'Kerrigan', 'Kerrigan', 'Ceballos']
total_ceballos=survey_responses.count('Ceballos')
print(total_ceballos)
percentage_ceballos=100*total_ceballos/len(survey_responses)
print(percentage_ceballos)

possible_surveys=np.random.binomial(70,0.54,size=10000)/70.
plt.hist(possible_surveys,range=(0,1),
bins=20)
plt.show()
ceballos_loss_surveys=np.mean(possible_surveys<0.5)
print(ceballos_loss_surveys)
large_survey=np.random.binomial(7000,0.54,10000)/7000.
ceballos_loss_new=np.mean(large_survey<0.5)
print(ceballos_loss_new)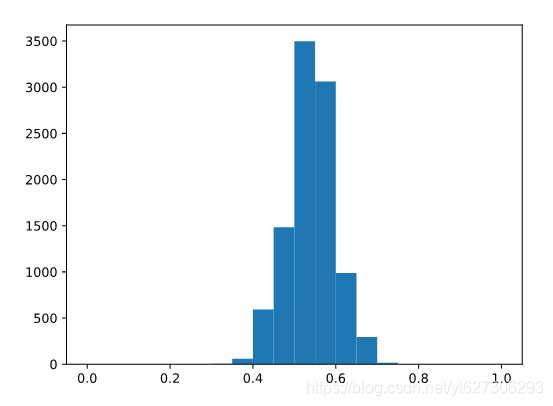
8.np.random.choice(array, size, replace=False)
从一组样本冲随机抽取size个成为新的样本