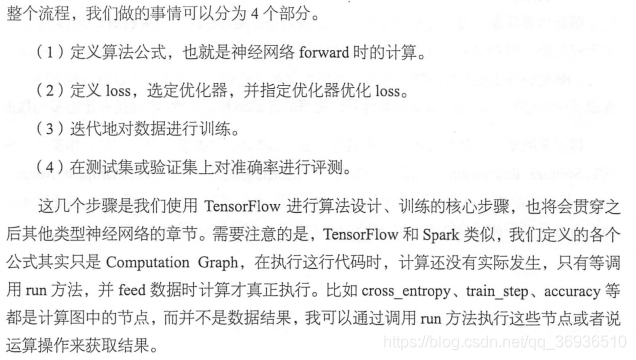
mnist数据包下载
https://pan.baidu.com/s/1c3QlQEW
mnist手写识别是机器学习领域中的Hello World任务。MNIST是由几万张28x28像素的手写数字组成,这些图片值包含灰度值信息。我们的任务就是对这些手写数字进行分类,识别出0-9。
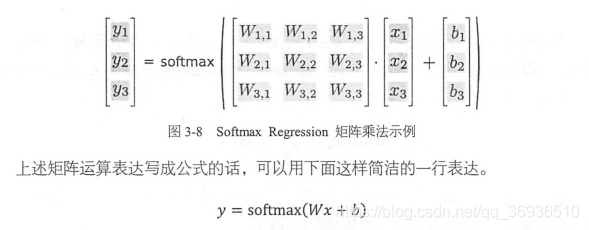
首先是将28x28像素的图片展开为784x1维的矩阵,每一个像素点实际上是一个float,值越大图片像素点越亮。其实手写识别任务就是我们将784维的数据转换成10维的数据。这样从784中的每一个值都会和10中的每一个值相连,相连时会有一个权重,我们训练神经网络就是在训练这些权重。权重w实际上是一个784x10的矩阵。
from tensorflow.examples.tutorials.mnist import input_data
import tensorflow as tf
import matplotlib.pyplot as plt
import numpy as np
#导入数据集,数据集中有55000个训练集样本,10000个测试集样本,5000个验证集样本
mnist = input_data.read_data_sets('F:/MNIST_data/',one_hot=True)
#[None, 784]表示有None(未知)张图片,每张图片是28*28像素的,展开的维度是784
x = tf.placeholder(tf.float32, [None, 784])
#w表示每一个特征值(像素点)会影响结果的权重,784是特征的维数,10代表有10类
W = tf.Variable(tf.zeros([784, 10]))
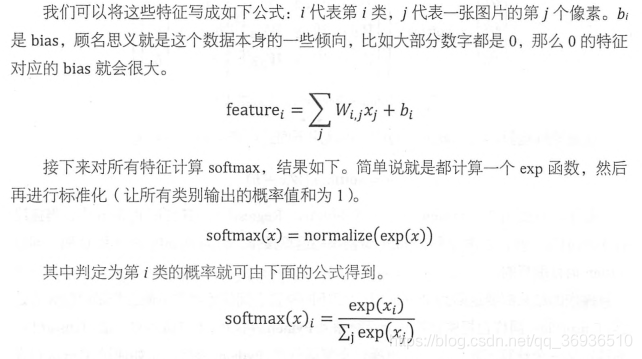
#bias,数据本身的一些倾向
b = tf.Variable(tf.zeros([10]))
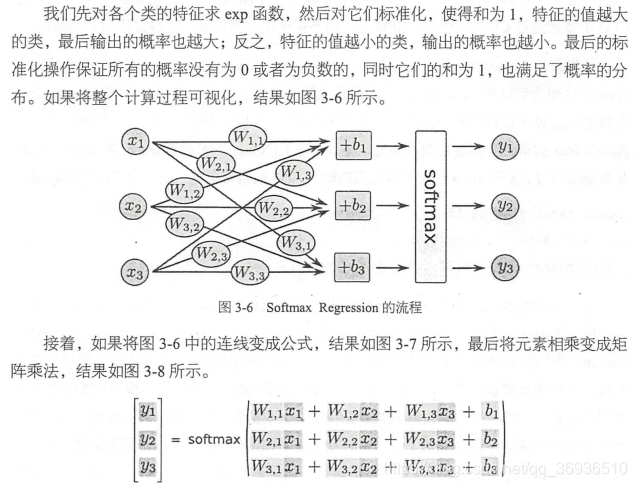
#定义Softmax Regression
y = tf.nn.softmax(tf.matmul(x, W) + b)
#是图片实际对应的值
y_ = tf.placeholder(tf.float32, [None, 10])
#cross_entropy优化目标
#cross_entropy = tf.reduce_mean(tf.nn.softmax_cross_entropy_with_logits(labels=y_, logits=y))
cross_entropy = tf.reduce_mean(-tf.reduce_sum(y_ * tf.log(y),reduction_indices=[1]))
#使用梯度下降法进行优化
train_step = tf.train.GradientDescentOptimizer(0.5).minimize(cross_entropy)
#创建会话
sess = tf.InteractiveSession()
#初始化全局参数
tf.global_variables_initializer().run()
#mnist.train 训练数据
for _ in range(1000):
#每次随机取100个样本进行训练
batch_xs, batch_ys = mnist.train.next_batch(100)
sess.run(train_step, feed_dict={x: batch_xs, y_: batch_ys})
#取得y得最大概率对应的数组索引来和y_的数组索引对比,如果索引相同,则表示预测正确
correct_prediction = tf.equal(tf.arg_max(y, 1), tf.arg_max(y_, 1))
#计算准确率,tf.cast将correct_prediction输出的bool值转换为float
accuracy = tf.reduce_mean(tf.cast(correct_prediction, tf.float32))
#打印准确率,在92%左右
print(sess.run(accuracy, feed_dict={x: mnist.test.images,
y_: mnist.test.labels}))
lenth = 1000
#查看在lenth个样本中的预测情况
for i in range(0, lenth):
#正确预测
result = sess.run(correct_prediction, feed_dict={x: np.array([mnist.test.images[i]]), y_: np.array([mnist.test.labels[i]])})
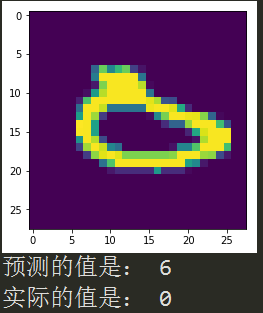
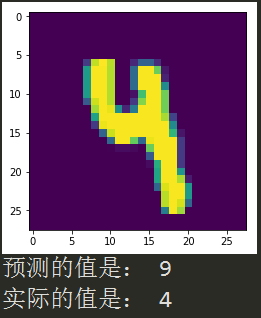
#错误预测则输出该图片
if not result:
#将748*1维的矩阵转换为28*28维
one_pic_arr = np.reshape(mnist.test.images[i], (28, 28))
#将矩阵中值转为float
pic_matrix = np.matrix(one_pic_arr, dtype="float")
#将矩阵显示为图片
plt.imshow(pic_matrix)
plt.show()
#预测值
forecast = sess.run(y, feed_dict={x: np.array([mnist.test.images[i]]), y_: np.array([mnist.test.labels[i]])})
#实际值
real = sess.run(y_,feed_dict={x: np.array([mnist.test.images[i]]), y_: np.array([mnist.test.labels[i]])})
#forecast和real是一个形如[[x,x,...,x]]的numpy array,将其转换为列表形式
forecast = forecast[0].tolist()
real = real[0].tolist()
#打印列表中最大值的索引,对应10个分类0-9
print('预测的值是:',forecast.index(max(forecast)))
print('实际的值是:',real.index(max(real)))
运行结果示例: