Zabbix自定义监控项:
监控项可以放在zabbix_agent.conf或者写入zabbix_agent.conf.d/*.conf
语法:UserParameter=key,command
一、检测mysql状态,有没有挂掉:
命令如下:mysqladmin -uroot -p123456 ping | grep alive
监控项配置如下:
UserParameter=mysql.status, mysqladmin -uroot -p123456 ping | grep alive
Ps:zabbix自带mysql监控模版,使用参考:
http://www.cnblogs.com/kevingrace/p/5618342.html
二、检测某个网页的连通性:
UserParameter=curl.hsadmin,curl -i -s https://admin-poct.heartsquare.com| grep HTTP | grep 200 | wc -l
UserParameter=curl.hsapi,curl -i -s https://api-poct.heartsquare.com/1.0/ | grep HTTP | grep 404 | wc -l
UserParameter=curl.jpush,curl -kis 'https://api.jpush.cn/v3/push' -X POST -d ''|grep HTTP |grep 401 | wc -l
三、检测时区
主要用到命令date +%Z%z
https://blog.csdn.net/qq_33317586/article/details/84102681
四、检测证书到期时间
Openssl命令
https://blog.csdn.net/qq_33317586/article/details/83902490
五、检测php状态
Nginx中写配置文件并在php配置文件中开启
https://blog.csdn.net/qq_33317586/article/details/83622754
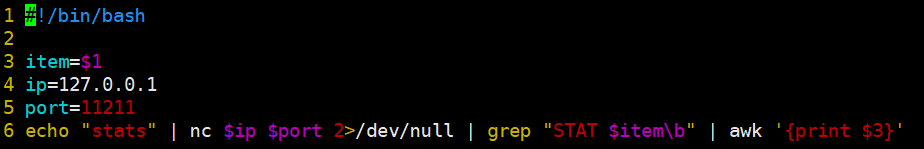
六、检查memcache状态:
关键在于对下面这个命令的输出进行过滤:
root@zabbix:/etc/zabbix# echo "stats" | nc 127.0.0.1 11211
自定义的监控项和监控脚本如下:
UserParameter=memcached.stat[*],/opt/zabbix/memcached-status.sh "$1"
七、监控mysql状态(使用percona)
参考:https://www.percona.com/doc/percona-monitoring-plugins/LATEST/zabbix/index.html
参考:https://blog.cactifans.com/2015/04/03/Monitor-MySQL-Zabbix/
参考:https://www.cnblogs.com/kevingrace/p/6256395.html
八、监控nginx
主要使用到了nginx的stub_status模块
https://blog.csdn.net/qq_33317586/article/details/85230455
九、监控redis
主要使用了redis的命令(必须要装上redis-server)
root@zabbix:~# redis-cli -h 127.0.0.1 -p 6379 info
百度搜zabbix监控redis发现zabbix还有官方给的模版??
监控redis参考:https://blog.csdn.net/qq_33317586/article/details/85232274