前面博客讲过 pyecharts 的用法,这里我们加上读取数据库内容,绘制图表!
一、配置python3的环境
pip install pymysql
pip install pyecharts
二、创建数据库
数据库名: python_echarts ,表名:clothing

以name为x轴,以num为y轴: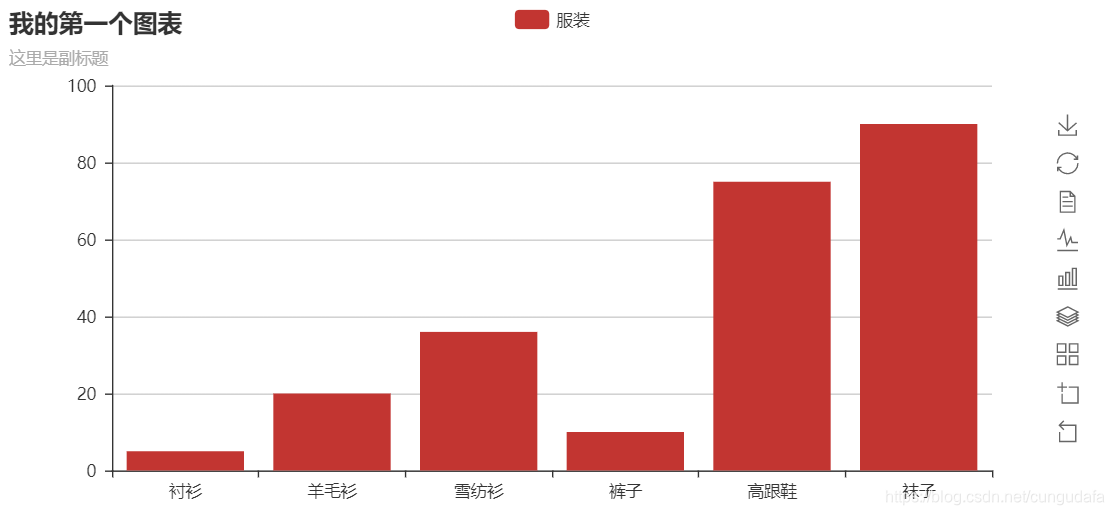
三、新建python3文件
我们这里主要有3步骤:
- python连接数据库获得x轴和y轴内容

- 查询数据库某一列保存为list(格式转换一下)
直接查看:str格式转换为list列表格式

- pyecharts绘表

源码:
from pymysql import *
from pyecharts import Bar

namelist = []
numlist = []


def getdata():
    conn = connect(host='127.0.0.1',
                   port=3306,
                   user='root',
                   password='wy123456',
                   db='python_echarts',
                   charset='utf8')
    cursor = conn.cursor()
    try:

        sql_name = """ SELECT name FROM clothing """
        cursor.execute(sql_name)
        names = cursor.fetchall()
        for name in names:
            namelist.append(name[0])
        # print(namelist)
        sql_num = """ SELECT num FROM clothing """
        cursor.execute(sql_num)
        nums = cursor.fetchall()
        for num in nums:
            numlist.append(num[0])
        # print(numlist)
    except:
        print("未查询到数据!")
        conn.rollback()
    finally:
        conn.close()


def drawecharts():
    bar = Bar("我的第一个图表", "这里是副标题")
    bar.add("服装", namelist,
            numlist, is_more_utils=True)
    bar.show_config()
    bar.render()


if __name__ == '__main__':
    getdata()
    drawecharts()