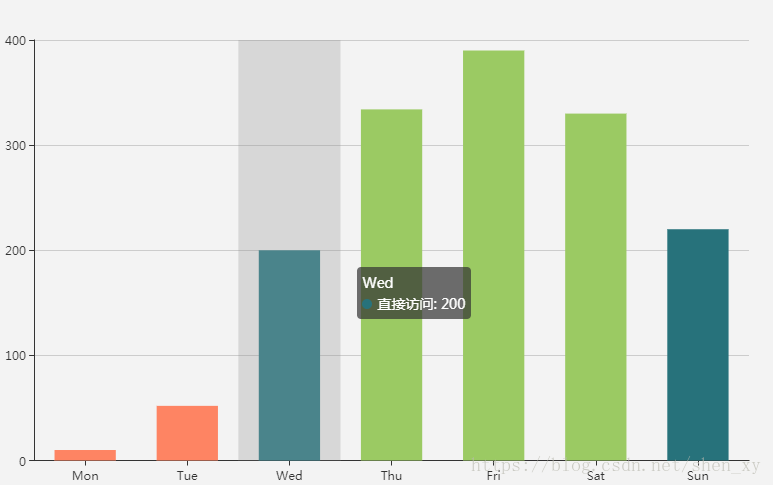
Echarts-图表根据值的不同展示成不同的颜色

series : [
        {
            name:'直接访问',
            type:'bar',
            barWidth: '60%',
            data:[10, 52, 200, 334, 390, 330, 220],
            itemStyle:{
                normal:{
                    color:function(params){
                        if(params.value >0 && params.value <100){
                            return "#FE8463";
                        }else if(params.value >=100 && params.value<=300 ){
                            return "#27727B";
                        }
                        return "#9BCA63";
                    }
                }
            }
        }
    ]

转自:https://blog.csdn.net/shen_xy/article/details/79852503

猜你喜欢

转载自www.cnblogs.com/bing0709/p/10601150.html
今日推荐