投票机制(voting)是集成学习里面针对分类问题的一种结合策略。基本思想是选择所有机器学习算法当中输出最多的那个类。机器学习分类算法的输出有两种类型:一种是直接输出类标签,另外一种是输出类概率,使用前者进行投票叫做硬投票(Majority/Hard voting),使用后者进行分类叫做软投票(Soft voting)。 sklearn中的投票机制使用VotingClassifier来实现。本文以iris数据集为例做实验验证!
1.硬投票是选择算法输出最多的标签,如果标签数量相等,那么按照升序的次序进行选择。实例代码如下:
from sklearn import datasets
from sklearn.model_selection import cross_val_score
from sklearn.linear_model import LogisticRegression
from sklearn.naive_bayes import GaussianNB
from sklearn.ensemble import RandomForestClassifier
import xgboost as xgb
from sklearn.ensemble import VotingClassifier
iris = datasets.load_iris()
X, y = iris.data[:,1:3], iris.target
clf1 = LogisticRegression(random_state=1)
clf2 = RandomForestClassifier(random_state=1)
clf3 = GaussianNB()
clf4 = xgb.XGBClassifier(max_depth=5, learning_rate=0.1, n_estimators=160)
eclf = VotingClassifier(estimators=[('lr',clf1),('rf',clf2),('gnb',clf3),('xgb',clf4)], voting='hard')
#使用投票法将三个模型结合在以前,estimotor采用 [(name1,clf1),(name2,clf2),...]这样的输入,和Pipeline的输入相同 voting='hard'表示硬投票
for clf, clf_name in zip([clf1, clf2, clf3, clf4, eclf],['Logistic Regrsssion', 'Random Forest', 'naive Bayes', 'xgboost', 'Ensemble']):
    scores = cross_val_score(clf, X, y, cv=5, scoring='accuracy')
    print('Accuracy: {:.2f} (+/- {:.2f}) [{}]'.format(scores.mean(), scores.std(), clf_name))
Accuracy: 0.90 (+/- 0.05) [Logistic Regrsssion]
Accuracy: 0.93 (+/- 0.05) [Random Forest]
Accuracy: 0.91 (+/- 0.04) [naive Bayes]
Accuracy: 0.95 (+/- 0.05) [xgboost]
Accuracy: 0.95 (+/- 0.05) [Ensemble]
2.软投票是使用各个算法输出的类概率来进行类的选择,输入权重的话,会得到每个类的类概率的加权平均值,值大的类会被选择。
from itertools import product
import numpy as np
import matplotlib.pyplot as plt
from sklearn import datasets
from sklearn.tree import DecisionTreeClassifier
from sklearn.neighbors import KNeighborsClassifier
from sklearn.svm import SVC
from sklearn.ensemble import RandomForestClassifier
import xgboost as xgb
from sklearn.ensemble import VotingClassifier
iris = datasets.load_iris()
X = iris.data[:,[0,2]] #取两列,方便绘图
y = iris.target
#实例化分类器
clf1 = DecisionTreeClassifier(max_depth=4)
clf2 = KNeighborsClassifier(n_neighbors=7)
clf3 = SVC(kernel='rbf', probability=True)
clf4 = RandomForestClassifier(random_state=1)
clf5 = xgb.XGBClassifier(max_depth=5, learning_rate=0.1, n_estimators=160)
eclf = VotingClassifier(estimators=[('dt',clf1),('knn',clf2),('svc',clf3),('rf',clf4),('xgb',clf5)], voting='soft', weights=[2,1,1,2,3])
#weights控制每个算法的权重, voting=’soft' 使用了软权重
#模型训练
clf1.fit(X,y)
clf2.fit(X,y)
clf3.fit(X,y)
clf4.fit(X,y)
clf5.fit(X,y)
eclf.fit(X,y)
#网格范围限定
x_min, x_max = X[:,0].min() -1, X[:,0].max() + 1
y_min, y_max = X[:,1].min() -1, X[:,1].max() + 1
xx, yy = np.meshgrid(np.arange(x_min, x_max, 0.01), np.arange(y_min, y_max, 0.01)) #创建网格
#zhou=np.c_[xx.ravel(), yy.ravel()]
#plt.imshow(xx)
fig, axes = plt.subplots(3, 2, sharex='col', sharey='row', figsize=(10, 8)) #共享X轴和Y轴
#for idx, clf, title in zip(product([0, 1],[0, 1]) #这里的顺序同plt.subplots(3, 2)的维度。
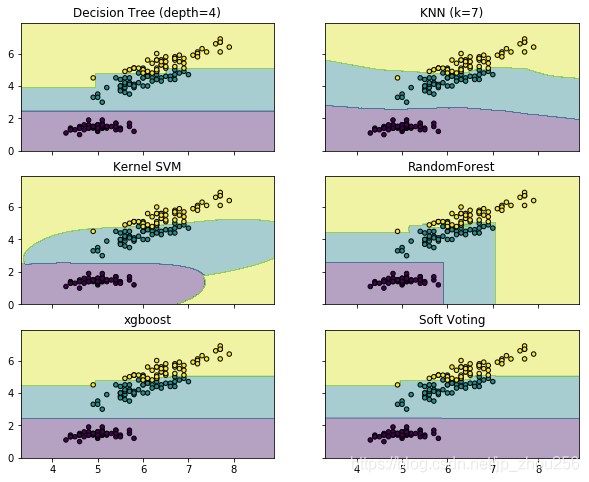
for idx, clf, title in zip(product([0, 1,2],[0, 1]),
[clf1, clf2, clf3, clf4,clf5,eclf],
['Decision Tree (depth=4)', 'KNN (k=7)',
'Kernel SVM','RandomForest','xgboost', 'Soft Voting']):
Z = clf.predict(np.c_[xx.ravel(), yy.ravel()]) #起初我以为是预测的X的值,实际上是预测了上面创建的网格的值,以这些值来进行描绘区域
Z = Z.reshape(xx.shape)
axes[idx[0], idx[1]].contourf(xx, yy, Z, alpha=0.4) #绘制等高线
axes[idx[0], idx[1]].scatter(X[:, 0],X[:, 1], c=y, s=20, edgecolor='k') #花上散点,颜色数=类别数
axes[idx[0], idx[1]].set_title(title)
plt.show()
#for idx, clf, title in zip(product([0,1, 2],[0,1]),
# [clf1, clf2, clf3, clf4,clf5,eclf],
# ['Decision Tree (depth=4)', 'KNN (k=7)',
# 'Kernel SVM','RandomForest','xgboost', 'Soft Voting']):
# print(idx)
# print('================')
#对于感兴趣的语句可以单独提取出来研究,因为Python既很好的支持面向过程,又能很好的支持面向对象封装
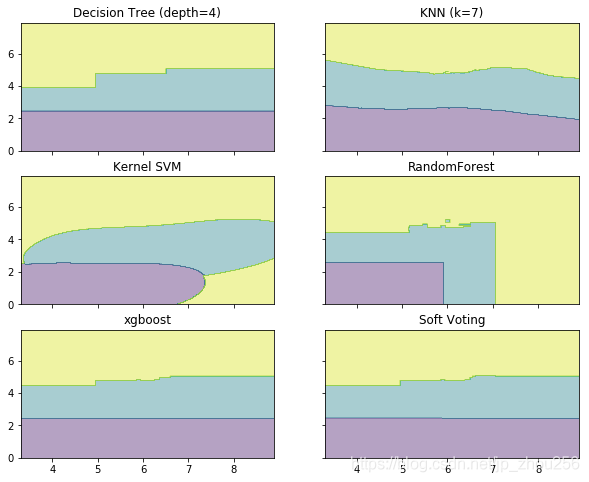
fig, axes = plt.subplots(3, 2, sharex='col', sharey='row', figsize=(10, 8)) #共享X轴和Y轴
#for idx, clf, title in zip(product([0, 1],[0, 1]) #这里的顺序同plt.subplots(3, 2)的维度。
for idx, clf, title in zip(product([0, 1,2],[0, 1]),
[clf1, clf2, clf3, clf4,clf5,eclf],
['Decision Tree (depth=4)', 'KNN (k=7)',
'Kernel SVM','RandomForest','xgboost', 'Soft Voting']):
Z = clf.predict(np.c_[xx.ravel(), yy.ravel()]) #起初我以为是预测的X的值,实际上是预测了上面创建的网格的值,以这些值来进行描绘区域
Z = Z.reshape(xx.shape)
axes[idx[0], idx[1]].contourf(xx, yy, Z, alpha=0.4) #绘制等高线
#axes[idx[0], idx[1]].scatter(X[:, 0],X[:, 1], c=y, s=20, edgecolor='k')
axes[idx[0], idx[1]].set_title(title)
plt.show()