It is not clear for many MySQL users that Percona XtraDB Cluster (PXC) and MariaDB Galera Clusterdepend on the same Galera library i.e used in Galera Cluster for MySQL which is provided by Codership team:
- Galera Cluster: MySQL Server (by Oracle) + Galera library.
- Percona XtraDB Cluster: Percona Server + Galera library.
- MariaDB Galera Cluster: MariaDB Server + Galera library.
But the question is, are there any performance differences between the three of them ?
Let's discover that by doing some simple benchmark to test MySQL write performance in Galera Cluster, PXC and MariaDB Galera Cluster installations.
SYSTEM INFORMATION:
HW CONFIGURATIONS (AWS SERVERS):
Nodes Servers HW configurations:
- CPU: Intel(R) Xeon(R) CPU E5-2680 v2 @ 2.80GHz (# of cores 8, # of threads 16, HT enabled).
- Memory: 16GB RAM.
- Storage: HDD 120GB/ 5400RPM.
Load balancer Server HW configurations:
- CPU: Intel(R) Xeon(R) CPU E5-2651 v2 @ 1.80GHz (# of cores 4, # of threads 8, HT enabled).
- Memory: 16GB RAM.
- Storage: HDD 10GB/ 5400RPM.
Load generator Server HW configurations:
- CPU: Intel(R) Xeon(R) CPU E5-2680 v2 @ 2.80GHz (# of cores 16, # of threads 32, HT enabled).
- Memory: 32GB RAM.
- Storage: HDD 10GB/ 5400RPM.
SOFTWARE CONFIGURATIONS:
- OS : Red Hat Enterprise Linux Server release 6.5 (Santiago)
- Sysbench : 0.5.3
- GLB : 1.0.0
- Galera Cluster : 5.5.34 and 5.6.16
- Percona XtraDB Cluster : 5.5.37 and 5.6.19
- MariaDB Galera Cluster : 5.5.38 and 10.0.12
- Galera Library : 3.5
TEST INFORMATION:
- The testing environment consists of 5 AWS servers, three servers for a three-node cluster (each node is installed on a single server), one server for the load balancer and the final server for the load generator in which sysbench is installed to send requests to the load balancer from.
- Sysbench command:
sysbench --num-threads=64 --max-requests=1000 --db-driver=mysql --test=/usr/share/doc/sysbench/tests/db/oltp.lua --mysql-table-engine=InnoDB --mysql-user=dev --mysql-password='test' --mysql-host=load_balancer_ip run. - Table structure which was used by sysbench tests:
mysql> show create table sbtest.sbtest\G CREATE TABLE `sbtest` ( `id` int(10) unsigned NOT NULL AUTO_INCREMENT, `k` int(10) unsigned NOT NULL DEFAULT '0', `c` char(120) NOT NULL DEFAULT '', `pad` char(60) NOT NULL DEFAULT '', PRIMARY KEY (`id`), KEY `k` (`k`) ) ENGINE=InnoDB AUTO_INCREMENT=8574 DEFAULT CHARSET=latin1 - The my.cnf used is something like:
[mysqld] key_buffer_size = 16M max_allowed_packet = 16M thread_stack = 192K thread_cache_size = 8 innodb_buffer_pool_size = 8G innodb_flush_log_at_trx_commit = 0 expire_logs_days = 10 max_binlog_size = 100M server-id = 1 log-bin = mysql-bin binlog_format = ROW auto_increment_increment = 3 auto_increment_offset = 1 log_slave_updates default_storage_engine = InnoDB # Path to Galera library wsrep_provider = /usr/lib64/galera/libgalera_smm.so # Cluster connection URL contains the IPs of node#1, node#2 and node#3 wsrep_cluster_address = gcomm://nodeB-IP,nodeC-IP innodb_autoinc_lock_mode = 2 # Node #1 address wsrep_node_address = nodeA-IP # Cluster name wsrep_cluster_name = test_cluster # SST method wsrep_sst_method = rsync # Authentication for SST method wsrep_sst_auth = "sst:password"
Notes:
- The number of threads used in this test is 64 as it generated the highest throughput on all cluster installations.
- Each throughput value for each test case is generated by the average of ten (10) times execution.
TESTING RESULTS:

The raw results in Transactions / Sec might be useful:
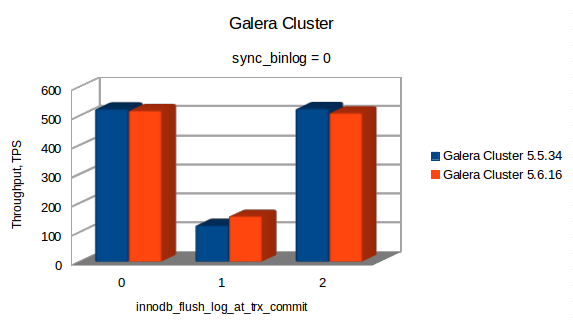
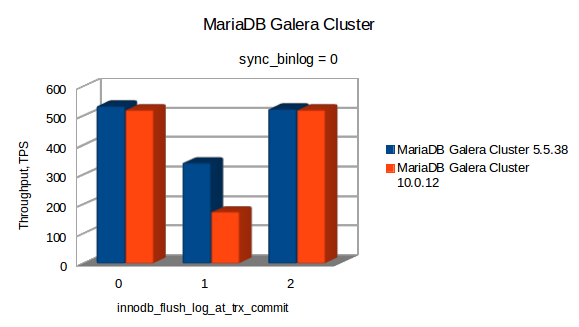
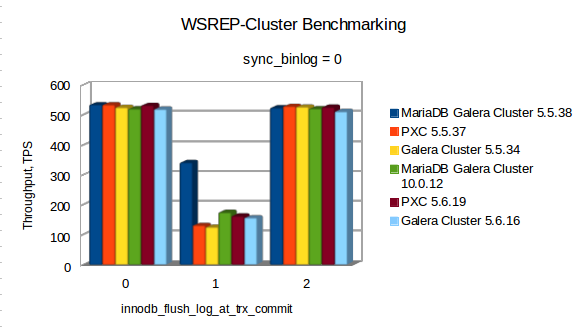
| SYNC_BINLOG=0 | ||||||
|---|---|---|---|---|---|---|
| INNODB_FLUSH_LOG_ AT_TRX_COMMIT | GALERA CLUSTER 5.5.34 | PXC 5.5.37 | MARIADB GALERA CLUSTER 5.5.38 | GALERA CLUSTER 5.6.16 | PXC 5.6.15 | MARIADB GALERA CLUSTER 10.0.12 |
| 0 | 525.119 | 534.022 | 534.249 | 519.575 | 532.19 | 520.736 |
| 1 | 125.615 | 131.748 | 341.384 | 157.001 | 162.783 | 174.97 |
| 2 | 526.761 | 528.858 | 524.039 | 511.817 | 526.06 | 521.024 |
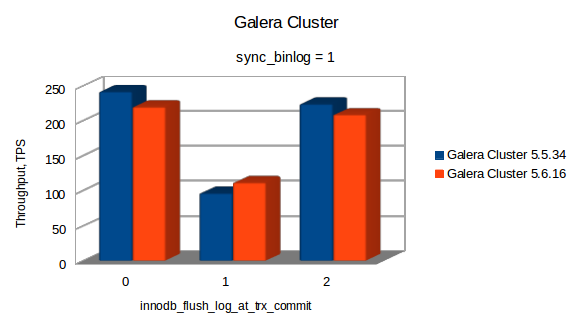
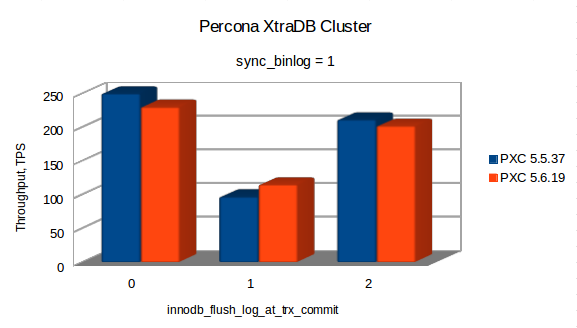
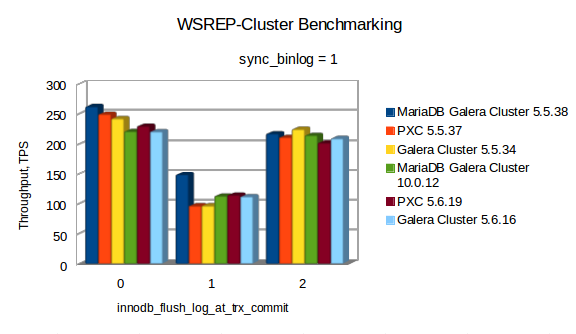
| SYNC_BINLOG=1 | ||||||
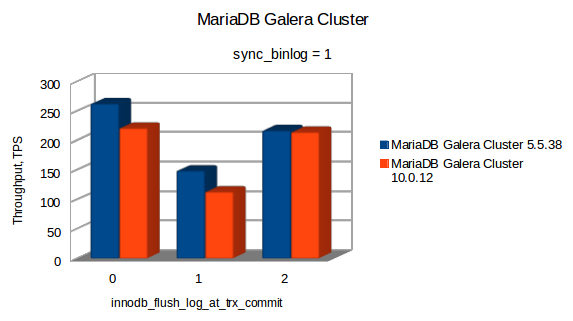
| 0 | 242.201 | 249.622 | 262.516 | 220.313 | 229.807 | 220.97 |
| 1 | 96.829 | 96.759 | 148.815 | 111.995 | 114.8 | 113.056 |
| 2 | 224.476 | 210.904 | 217.142 | 209.139 | 201.596 | 214.311 |
CONCLUSION
According to the above results:
innodb_flush_log_at_trx_commit = 1significantly slows down Galera.sync_binlogalso cuts in half the throughput.- All other are more or less equal in throughput.