scatter函数
matplotlib.pyplot.scatter(
x, y, s=None, c=None, marker=None,
cmap=None, norm=None, vmin=None, vmax=None,
alpha=None, linewidths=None, verts=None, edgecolors=None,
hold=None, data=None, **kwargs)
参数
x, y : 类数组,数据的坐标
s : 类数组,标记符号(marker)的大小,默认rcParams['lines.markersize'] ** 2
c : 类数组,标记符合的颜色,默认‘b’,可以至设置一个,不能单个的RGB or RGBA,如果要使用二维数组
marker : 标记符合,默认使用圆圈
cmap : Colormap实例,主要是c是浮点时候映射颜色默认是rc image.cmap
norm : Normalize实例,可选,衡量颜色亮度默认colors.Normalize
vmin, vmax : 标量,可选,当设置了norm的时候,控制c连接norm中的使用的最大和最小值
alpha : 标量,可选,透明度0(透明)到1(不透明)之间
linewidths : 标量或者类数组,marker的表的大小,可选默认rcParams lines.linewidth
verts : 序列 to (x, y), 可选,vertex(顶点)当marker为空的时候,用来构造marker
edgecolors : marker边的颜色, default: ‘face’
扫描二维码关注公众号,回复:
591229 查看本文章


返回值
paths : PathCollection
cmap 对比
#-*-coding:utf-8-*-
import numpy as np
import matplotlib.pyplot as plt
import matplotlib.cm as cm

# 设置种子让他可以复现
np.random.seed(19680801)

N = 50
x = np.random.rand(N)
y = np.random.rand(N)
# 随机生成50个浮点作为颜色,映射Colormap
colors = np.random.rand(N)

# 随机生成面积
area = np.pi * (15 * np.random.rand(N))**2

# alpha是这种透明度,我们可以看到一些圆下面的一些圆
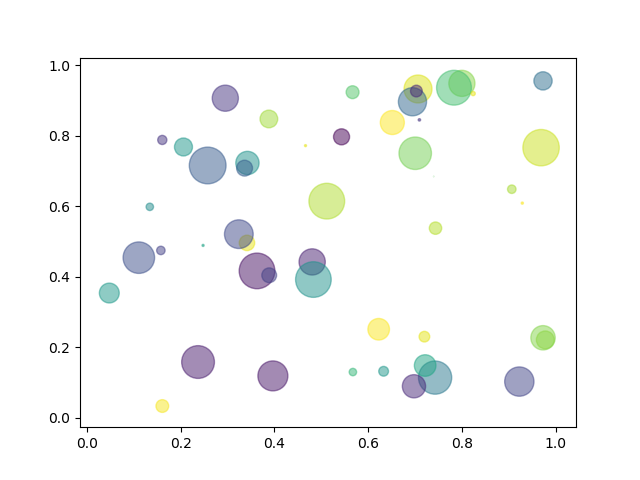
# plt.scatter(x, y, s=area, c=colors, alpha=0.5)
# plt.savefig('cm_image.cmap.png')

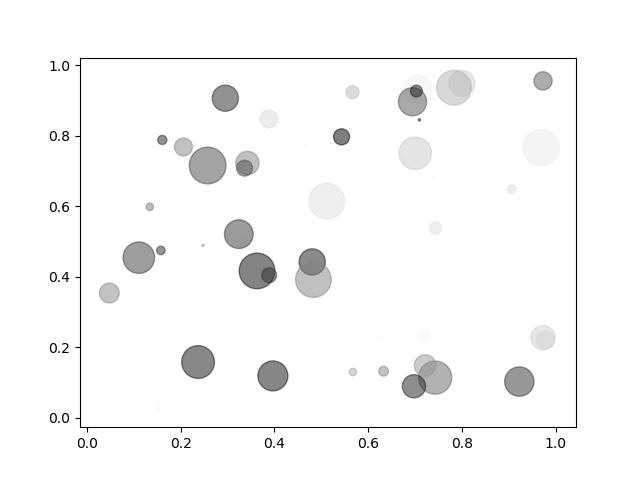
plt.scatter(x, y, s=area, c=colors, alpha=0.5,cmap=cm.gray)
plt.savefig('cm_cm.gray.png')
plt.show()
看下面2张图片可以对比一些使用默认的image.cmap和cm.gray的区别
marker
#-*-coding:utf-8-*-
import matplotlib.pyplot as plt
import numpy as np
import matplotlib

np.random.seed(20180406)
x = np.arange(0.0, 40.0, 2.0)
y = x ** 1.3 + np.random.rand(*x.shape) * 30.0
s = np.random.rand(*x.shape) * 800 + 500

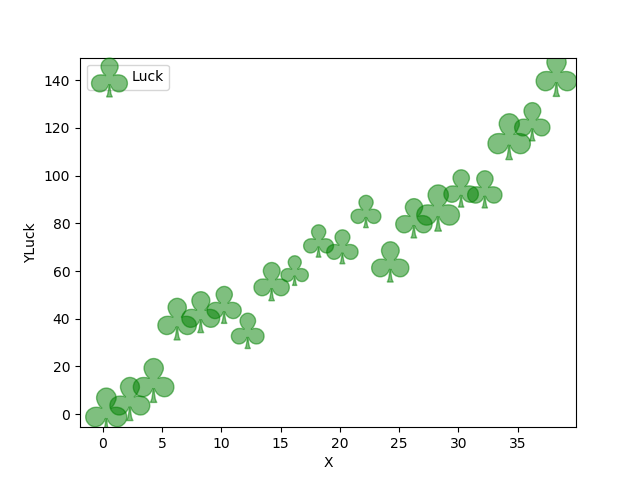
plt.scatter(x, y, s, c="g", alpha=0.5, marker=r'$\clubsuit$',label="Luck")
plt.xlabel("X")
plt.ylabel("YLuck")
plt.legend(loc=2)
plt.savefig("luck.png")
plt.show()
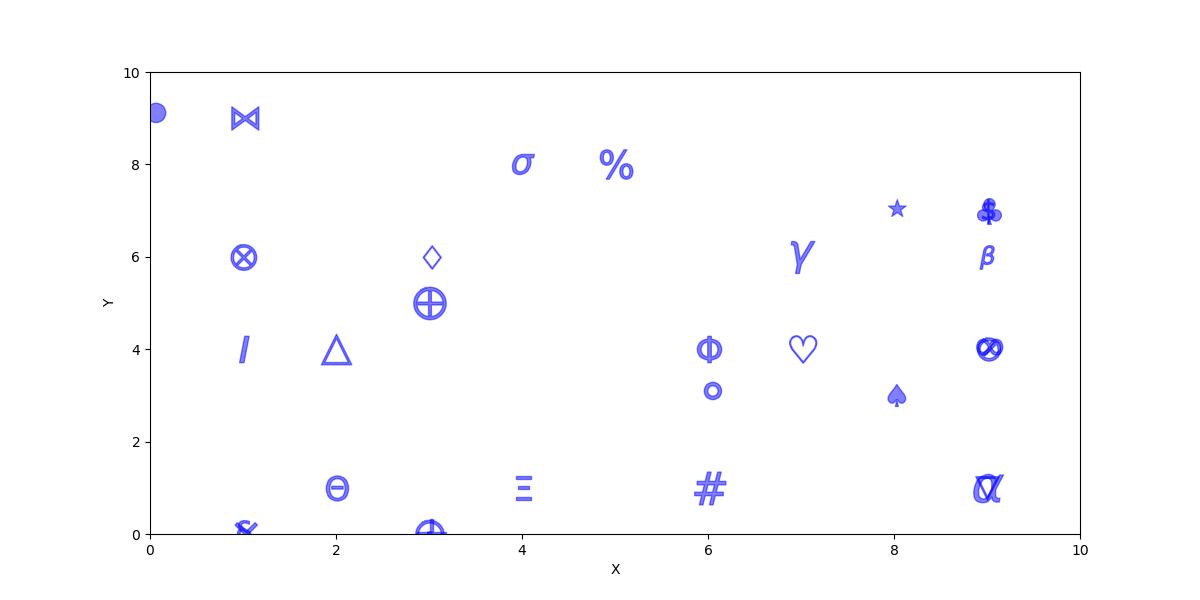
更多的marker
#-*-coding:utf-8-*-
from matplotlib import pyplot as plt
import numpy as np
from numpy.random import randint
import matplotlib

x = np.arange(0.0, 100.0, 2.0)
y = x ** 1.3 + np.random.rand(*x.shape) * 30.0
s = np.random.rand(*x.shape) * 800 + 500

markers = ['\\alpha', '\\beta', '\gamma', '\sigma','\infty', \
            '\spadesuit', '\heartsuit', '\diamondsuit', '\clubsuit', \
            '\\bigodot', '\\bigotimes', '\\bigoplus', '\imath', '\\bowtie', \
            '\\bigtriangleup', '\\bigtriangledown', '\oslash' \
           '\ast', '\\times', '\circ', '\\bullet', '\star', '+', \
            '\Theta', '\Xi', '\Phi', \
            '\$', '\#', '\%', '\S']

def getMarker(marker):
    return "$"+marker+"$"

for marker in markers:
    plt.plot(randint(0,10,1), randint(0,10,1), "b", alpha=0.5, marker=getMarker(marker), markersize=randint(16,26,1))


plt.xlabel("X")
plt.ylabel("Y")
plt.xlim(0,10)
plt.ylim(0,10)
plt.gcf().set_size_inches(12,6)
# plt.savefig("marker.png")
plt.show()
vert
#-*-coding:utf-8-*-
import numpy as np
import matplotlib.pyplot as plt

np.random.seed(20180406)


x = [1,2,3,4]
y = [1,2,3,4]
z = np.random.rand(4)

verts = np.array([[-1, -1], [1, -1], [1, 1], [-1, -1]])
plt.subplot(321)
plt.scatter(x, y, s=80, c=z, marker=None, verts=verts)
plt.xlabel("X")
plt.ylabel("Y")
plt.xlim(0,5)
plt.ylim(0,5)

verts = np.array([[0, 0], [1, -1], [1, 1], [-1, -1]])
plt.subplot(322)
plt.scatter(x, y, s=80, c=z, marker=(verts, 0))
# 等价于:
# plt.scatter(x, y, s=80, c=z, marker=None, verts=verts)

plt.xlabel("X")
plt.ylabel("Y")
plt.xlim(0,5)
plt.ylim(0,5)


verts = np.array([[0,0], [0, -1], [1, 1]])
plt.subplot(323)
plt.scatter(x, y, s=80, c=z, marker=None, verts=verts)
plt.xlabel("X")
plt.ylabel("Y")
plt.xlim(0,5)
plt.ylim(0,5)


verts = np.array([[-1,1], [0,0],[-1,-1]])
plt.subplot(324)
plt.scatter(x, y, s=80, c=z, marker=None, verts=verts)
plt.xlabel("X")
plt.ylabel("Y")
plt.xlim(0,5)
plt.ylim(0,5)

verts = np.array([[-1,1], [1, 1],[-1,-1]])
plt.subplot(325)
plt.scatter(x, y, s=80, c=z, marker=None, verts=verts)
plt.xlabel("X")
plt.ylabel("Y")
plt.xlim(0,5)
plt.ylim(0,5)

verts = np.array([[-1,1], [1, 1],[1,-1]])
plt.subplot(326)
# plt.scatter(x, y, s=80, c=z, marker=None, verts=verts,linewidths=5)
plt.scatter(x, y, s=80, c=z, marker=None, verts=verts)
plt.xlabel("X")
plt.ylabel("Y")
plt.xlim(0,5)
plt.ylim(0,5)


plt.gcf().set_size_inches(12,6)
plt.savefig("vert.png")
plt.show()
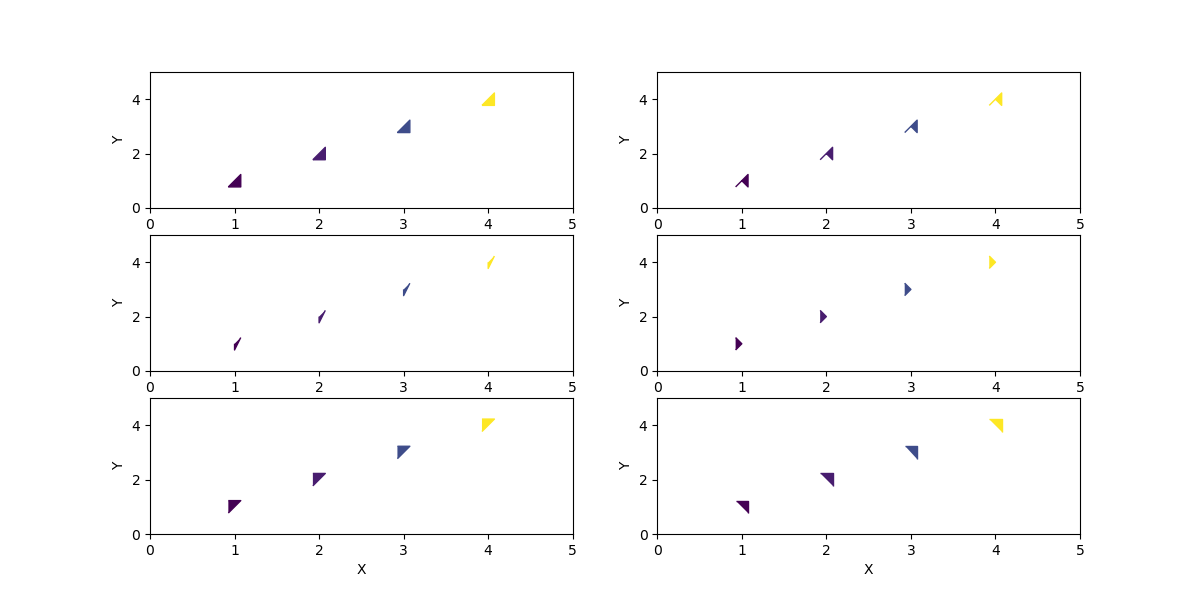
vert参数怎么影响图像的真的不太清楚,从文档看,然后实验猜测一下,应该是没有marker的时候可以使用vert提供的顶点来构造marker,具体怎样构造的不太清楚。大概想以数据x,y为中心,[-1,-1]向左下,[-1,1]左上,[1,-1]右下,[1,1]右上这中节奏。
linewidths
#-*-coding:utf-8-*-
import numpy as np
import matplotlib.pyplot as plt
x = range(30)

ColorBase = ['r','g','b','c','k','m','y']
Marker = 'o'
EdgeColor = ('k','k','r','r','g','g')

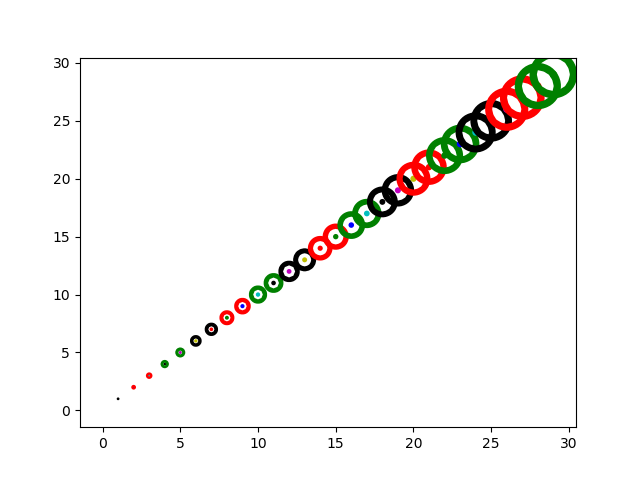
plt.scatter(x,x,s=x,c=ColorBase,marker='o',linewidths=x,edgecolors=EdgeColor)
plt.savefig('edgecolors.png')
plt.show()
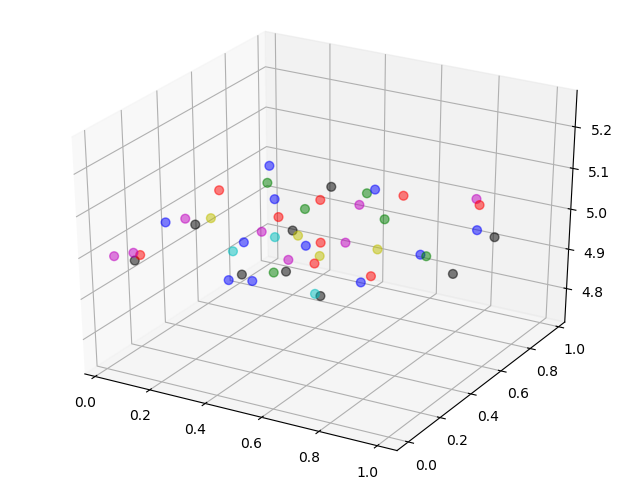
3D scatter
#-*-coding:utf-8-*-
from mpl_toolkits.mplot3d import Axes3D
from matplotlib import pyplot as plt
import numpy as np
import random

ax = Axes3D(plt.figure())
NumP = 50
x = np.random.rand(NumP)
y = np.random.rand(NumP)
z = np.random.rand(NumP)
# c = ['r','g','b','c','k','m','y']
# color = "rgbckmy"
# cl = random.sample('rgbckmy',200)
cl = []
for i in range(50):
    cl.append(random.choice('rgbckmy'))

ax.scatter(x,y,5,s=40,c=cl,edgecolor=cl,alpha=0.5)
plt.savefig('3D.png')
plt.show()
