原文来源:
https://www.kaggle.com/roshan77/youtube-data-who-got-the-most-subscribers
介绍:
Python笔记 使用来自Socialblade的Youtube前5000个频道的数据。
数据来源:
Socialblade提供的Youtube最受欢迎的5000个频道数据。
Socialblade列出的YouTube前5000个频道的总体指标。
https://www.kaggle.com/mdhrumil/top-5000-youtube-channels-data-from-socialblade
数据下载:https://www.kaggle.com/mdhrumil/top-5000-youtube-channels-data-from-socialblade/downloads/top-5000-youtube-channels-data-from-socialblade.zip/2
你对以下方面感兴趣:
1、哪个YouTube频道拥有最多的观众、订阅者、视频上传量等等?
2、更多的视频上传会带来更多的视频浏览量和更多的订阅者吗?
3、更多的用户会提供更多的视频浏览量吗?
4、有没有一种方法可以根据频道上传的视频数量和观看视频的次数来预测订阅用户的数量?
我试着用一些视觉工具和分析工具来回答这些问题。
import numpy as np
import pandas as pd

import os
print(os.listdir("../input"))  #选择数据存放路径 获取到data.csv文件
[‘data.csv’]
import matplotlib.pyplot as plt
import seaborn as sns
from sklearn.model_selection import train_test_split
from sklearn.linear_model import LinearRegression
from sklearn import metrics
import statsmodels.api as sm
from pandas.core import datetools

df = pd.read_csv('../input/data.csv')

df.head()

Out():
Rank	Grade	Channel name	Video Uploads	Subscribers		Video views
1st		A++		Zee TV			82757			18752951		20869786591
2nd		A++		T-Series		12661			61196302		47548839843
3rd		A++		Cocomelon-Nursery Rhymes	373	19238251		9793305082
4th		A++		SET India		27323			31180559			22675948293
5th		A++		WWE				36756			32852346			26273668433

df.tail()

Out():
		Rank	Grade	Channel name	Video Uploads	Subscribers	Video views
4995	4,996th	B+	Uras Benlioğlu	706	2072942	441202795
4996	4,997th	B+	HI-TECH MUSIC LTD	797	1055091	377331722
4997	4,998th	B+	Mastersaint	110	3265735	311758426
4998	4,999th	B+	Bruce McIntosh	3475	32990	14563764
4999	5,000th	B+	SehatAQUA	254	21172	73312511

df.info()
Out():
<class 'pandas.core.frame.DataFrame'>
RangeIndex: 5000 entries, 0 to 4999
Data columns (total 6 columns):
Rank             5000 non-null object
Grade            5000 non-null object
Channel name     5000 non-null object
Video Uploads    5000 non-null object
Subscribers      5000 non-null object
Video views      5000 non-null int64
dtypes: int64(1), object(5)
memory usage: 234.5+ KB


#df['Subscribers'] = df['Subscribers'].convert_objects(convert_numeric=True)
#df['Video Uploads'] = df['Video Uploads'].convert_objects(convert_numeric=True)

df['Subscribers'] = pd.to_numeric(df['Subscribers'], errors='coerce')
df['Video Uploads'] = pd.to_numeric(df['Video Uploads'], errors='coerce')
探索性数据分析
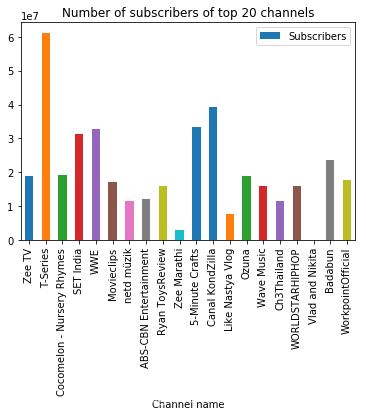
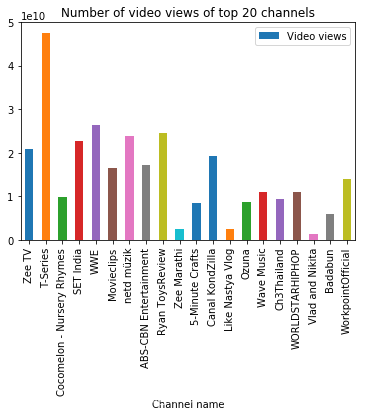
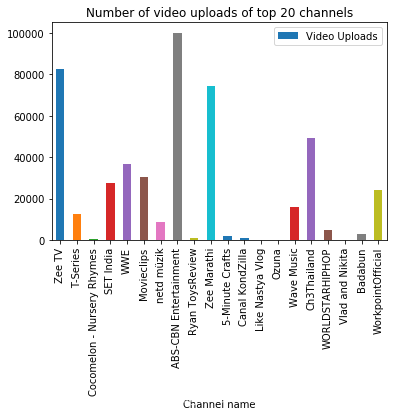
在这里,我首先绘制一些条形图,显示每种通道分类的前20名。根据排名,前三名都是前20名,他们的上传视频数量、订阅者和视频浏览量都在前三名。根据每个小组各自的情况,最后三名都进入了前20名。
df.head(20).plot.bar(x = 'Channel name', y = 'Subscribers')
plt.title('Number of subscribers of top 20 channels')
df.head(20).plot.bar(x = 'Channel name', y = 'Video views')
plt.title('Number of video views of top 20 channels')
df.head(20).plot.bar(x = 'Channel name', y = 'Video Uploads')
plt.title('Number of video uploads of top 20 channels')
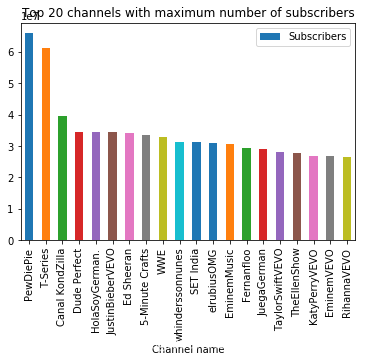
df.sort_values(by = ['Subscribers'], ascending = False).head(20).plot.bar(x = 'Channel name', y = 'Subscribers')
plt.title('Top 20 channels with maximum number of subscribers')
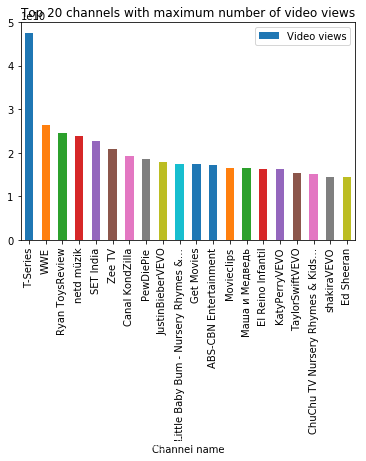
df.sort_values(by = ['Video views'], ascending = False).head(20).plot.bar(x = 'Channel name', y = 'Video views')
plt.title('Top 20 channels with maximum number of video views')
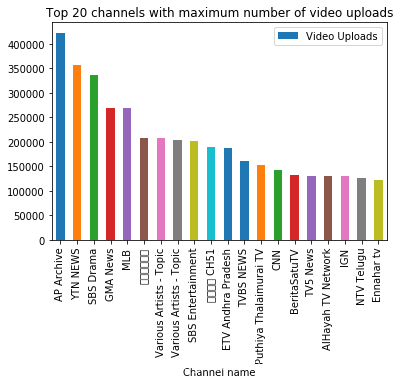
df.sort_values(by = ['Video Uploads'], ascending = False).head(20).plot.bar(x = 'Channel name', y = 'Video Uploads')
plt.title('Top 20 channels with maximum number of video uploads')
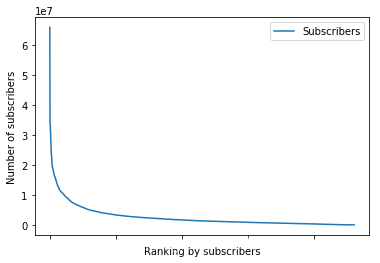
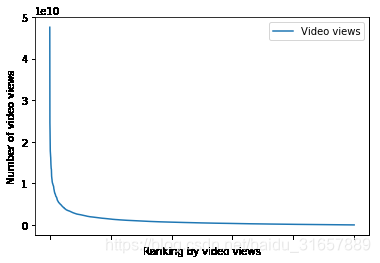
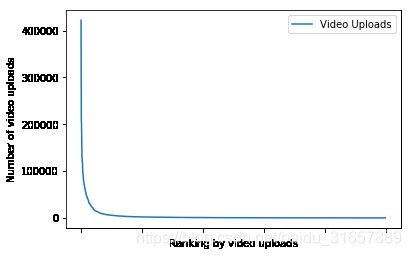
在这里,我感兴趣的是列表中的所有通道是如何按照订阅服务器、视频上传和订阅服务器在每个类中从最大值到最小值分布的。令人感兴趣的是,在顶部列表处有巨大的峰值,并且趋向于快速地获得一个趋于平缓的平台。
df.sort_values(by = ['Subscribers'], ascending = False).plot(x = 'Channel name', y = 'Subscribers')
plt.xlabel('Ranking by subscribers')
plt.ylabel('Number of subscribers')
df.sort_values(by = ['Video views'], ascending = False).plot(x = 'Channel name', y = 'Video views')
plt.xlabel('Ranking by video views')
plt.ylabel('Number of video views')
df.sort_values(by = ['Video Uploads'], ascending = False).plot(x = 'Channel name', y = 'Video Uploads')
plt.xlabel('Ranking by video uploads')
plt.ylabel('Number of video uploads')
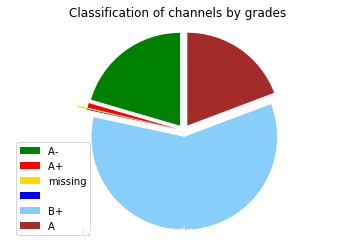
按照频道等级分析
grade_name = list(set(df['Grade']))
grade_name

output:['A- ', 'A+ ', 'A++ ', '\xa0 ', 'B+ ', 'A ']

df_by_grade = df.set_index(df['Grade'])

count_grade = list()
for grade in grade_name:
    count_grade.append(len(df_by_grade.loc[[grade]]))

df_by_grade.head()

out:
Grade	Rank	Grade	Channel name	Video Uploads	Subscribers	Video views
A++	1st	A++	Zee TV	82757.0	18752951.0	20869786591
A++	2nd	A++	T-Series	12661.0	61196302.0	47548839843
A++	3rd	A++	Cocomelon - Nursery Rhymes	373.0	19238251.0	9793305082
A++	4th	A++	SET India	27323.0	31180559.0	22675948293
A++	5th	A++	WWE	36756.0	32852346.0	26273668433

print(count_grade)
print(grade_name)

out:
[963, 2956, 10, 1024, 41, 6]
['A ', 'B+ ', 'A++ ', 'A- ', 'A+ ', '\xa0 ']

grade_name[2] = 'missing'

labels = grade_name
sizes = count_grade
explode1 = (0.2, 0.2, 0.5, 0.2, 0.2, 0.2)
color_list = ['green',  'red', 'gold', 'blue', 'lightskyblue', 'brown']
patches, texts = plt.pie(sizes, colors = color_list, explode = explode1,
                         shadow = False, startangle = 90, radius = 3)
plt.legend(patches, labels, loc = "best")
plt.axis('equal')
plt.title('Classification of channels by grades')
plt.show()
df.describe()
out:

	Video Uploads	Subscribers	Video views
count	4994.000000	4.613000e+03	5.000000e+03
mean	3859.463556	2.620004e+06	1.071449e+09
std	17085.866498	3.926447e+06	2.003844e+09
min	1.000000	3.010000e+02	7.500000e+01
25%	141.000000	6.098940e+05	1.862329e+08
50%	443.000000	1.350477e+06	4.820548e+08
75%	1501.750000	2.950056e+06	1.124368e+09
max	422326.000000	6.599531e+07	4.754884e+10
变量之间的关系
从下图可以看出,订阅者的数量与观看者的数量呈正相关关系。这是预期。但用户数量与该频道上传的视频数量呈负相关。这可能令人惊讶。吸引更多浏览者的视频频道和用户上传的视频数量都在减少。