How To Configure NetScaler AppFlow for SolarWinds
来源 https://support.citrix.com/article/CTX227300
Article | Configuration | Created: 02 Sep 2017 | Modified: 04 Sep 2017
Applicable Products
- NetScaler
Objective
This article describes how to configure NetScaler AppFlow for SolarWinds.
Network taps, span ports and aggregators are soon becoming defunct with the Cloud revolution picking up steam and making IT pros rethink their application performance monitoring (APM) strategy. Unlike proprietary packet capture tools, AppFlow leverages in-place footprints within existing infrastructure, virtualized, cloud or otherwise, and delivers the APM data in an industry standard format that is modeled on the success of NetFlow/IPFIX. Steve Shah’s recent blogs Splunk and AppFlow & Changing the Market Landscape of APM call out the business drivers of NetScaler AppFlowTM. Here we will focus on the technical aspects of NetScaler AppFlowTM . The recent inundating requests from customers and sales teams alike prompted me to write this blog outlining the installation instructions to implement NetScaler AppFlowTM with Splunk and/or Solarwinds.
AppFlow is an advanced feature available on all NetScaler editions – standard, enterprise and platinum, for the NetScaler products. The NetScaler version required would be 9.3.49.5 or higher and remember all such new features like AppFlow & DataStream are only available in the nCore builds. Do remember to bind the appflow policies to the specific Vservers that you want AppFlow data to be generated.
Instructions
Using NetScaler CLI
enable feature appflow
add appflow collector solarwinds_OR_splunk -IpAddress 10.217.100.100 ( port is optional default is UDP 4739)
add appflow action log_appflow -collectors solarwinds_OR_splunk
add appflow policy log_all true log_all_records ( this is the simplest policy, one of the more useful ones is in the support article mentioned above)
Now bind this policy to the vservers that needs to be monitored – > this step is critical without which no AppFlow records are generated.(Appflow can be some bound globally by command: bind appfw global <policyName> <priority> )
bind lb vserver <vservername> -policyName log_all -priority 100
Check to make sure the vserver and the services bound have appflow enabled ( by default appflow is enabled).
show lb vserver <vservername> | grep Appflow should show “Appflow logging: ENABLED”
show service <servicename> | grep Appflow should also show “Appflow logging: ENABLED”
If appFlow is not enabled here is how one can enable this
set service <service> -appflowLog ENABLED
set lb vserver <vserver> -appflowLog ENABLED
AppFlow Settings
Please set the desired appflow parameters to be included in the Appflow records. For a Proof of Concept please enable all fields.
show appflow param
AppFlow parameters
IPFIX template refresh interval: 600 seconds
Appname refresh interval: 600 seconds
IPFIX flow record export interval: 600 seconds
IPFIX UDP Path MTU: 1472 bytes
HTTP URL logging: ENABLED
HTTP cookie logging: ENABLED
HTTP referer logging: ENABLED
HTTP method logging: ENABLED
HTTP host logging: ENABLED
HTTP user-agent logging: ENABLED
Log only client-side traffic: NO
Done
To enable each field follow this example of enabling httpUserAgent.
set appflow param -httpUserAgent ENABLED
Set IPFIX flow record export interval to 60 seconds for faster AppFlow data export.
set appflow param -flowRecordInterval 60
Solarwinds AppFlow Tool configuration
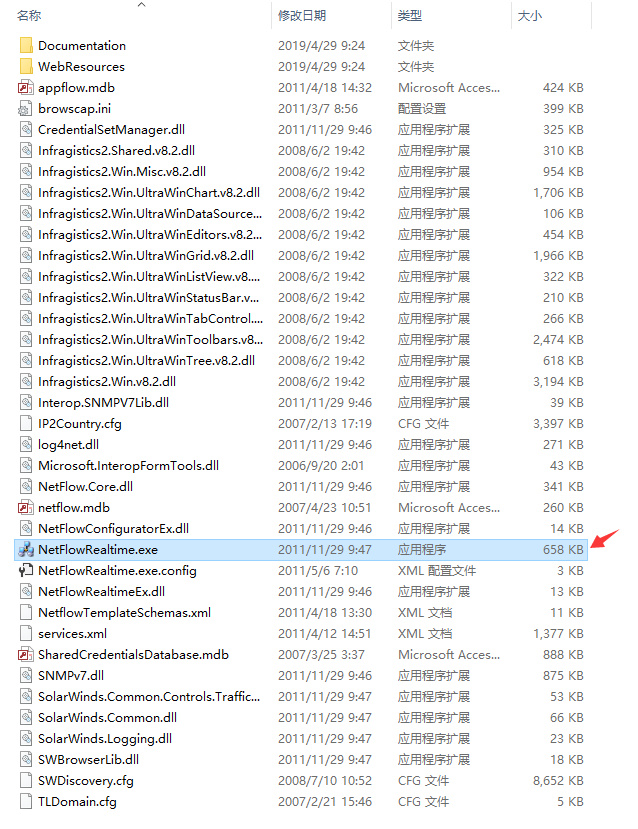
Download from here Solarwinds AppFlow Free tool . To have this on the production ORION software please contact your Solarwinds Sales team.
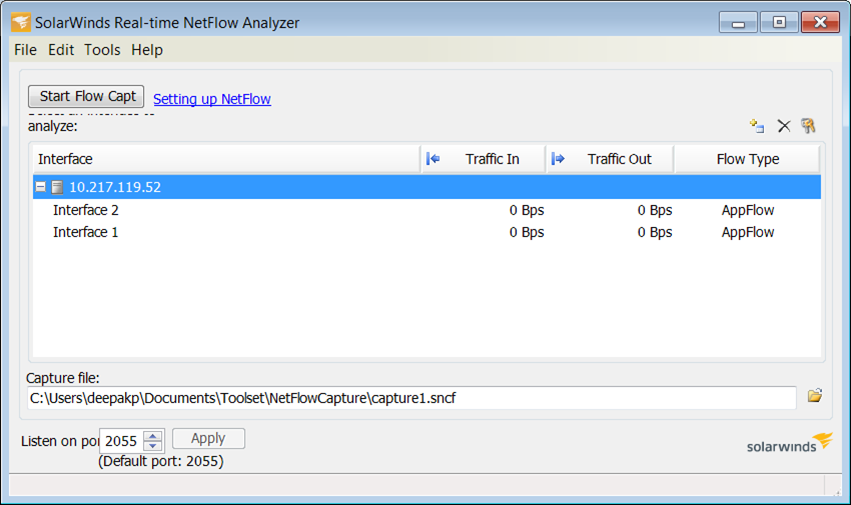
On the startup screen make sure the UDP port matches the one on the NetScaler. Solarwinds Tool defaults to 2055. This is the only config change needed for Solarwinds.
A successful configuration and continuous reception of AppFlow data results in the following screen. The free tool functions for only one hour on each run.

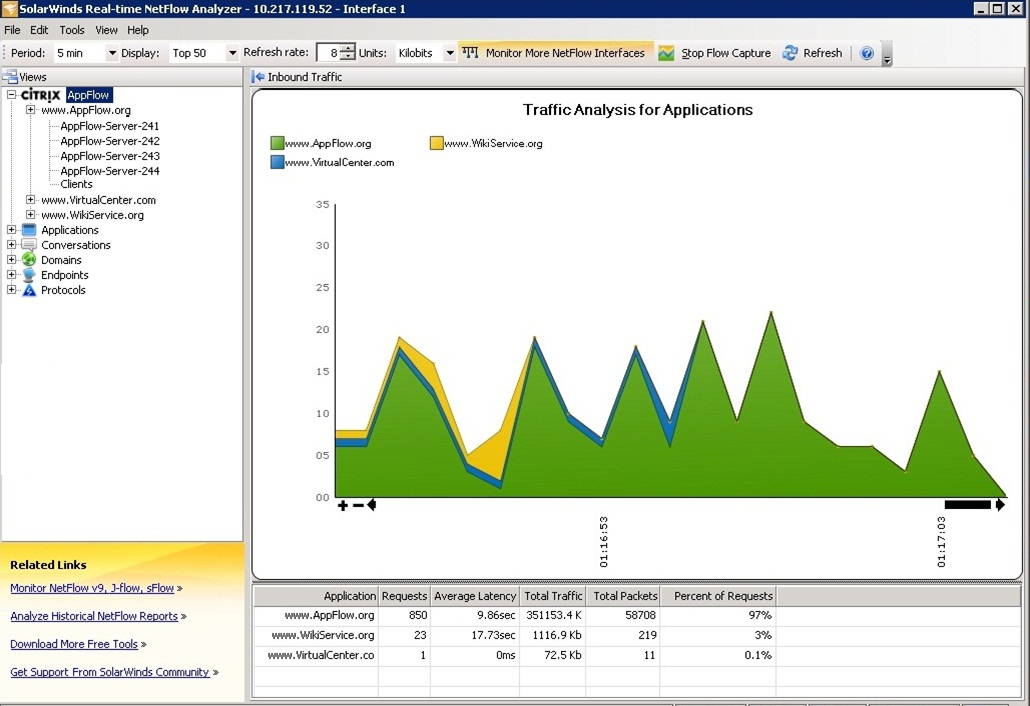
This will be the main screen on Solarwinds once a decent number of AppFlow records are collected.
Splunk AppFlow Configuration
Download the Free Splunk App from here http://www.splunk.com/download?r=header . For further installation instructions please go to http://www.splunk.com/base/Documentation. Splunk App needed would be 4.2.2 or greater.
Now download the SplunkforCitrixNetScaler.tgz Appflow plugin from splunkbase.com here Splunk for Citrix NetScaler with AppFlow . This plugin works with the production Splunk App as well as the free one mentioned above.
To install the app, Click on App menu and choose “Manage apps” Now Click on “Install app from file” to arrive at the following screen. specify the location of the SplunkforCitrixNetScaler.tgz file for upload.

For Splunk Windows installs *only* the inputs.conf should be modified to look like this. The location of inputs.conf is in the image. Only lines 1 and 5 are modified from the original install to correct the Unix “/” to windows “\”

The configuration file (config.ini) is located in the app’s “default” directory, which is $SPLUNK_HOME/etc/apps/SplunkforCitrixNetScaler/default/config.ini (unix install) . The AppFlow dashboards and reports rely on the sourcetype=appflow. To change the UDP port for appflow one has to edit the config.ini and restart Splunk. By default Splunk and NetScaler both use UDP 4739 so no need to change to get it started.

Now Restart the Splunk Server to make sure the changed settings are applied. The successful install will result in the following screen. Be sure to click on “AppFlow” tab.

======================== End