<template>
<div class="mapCont">
<div id="mapSelf"></div>
</div>
</template>
<script>
// import $echarts from "../../node_modules/echarts/dist/echarts";//main.js不全局引的话 ,这要单独引入
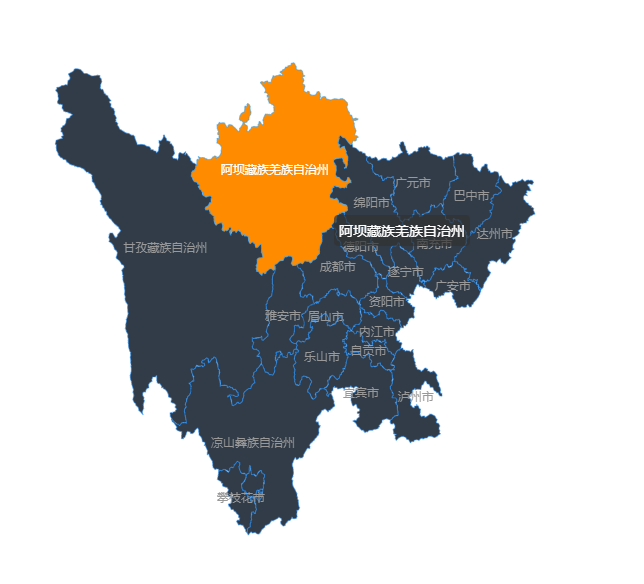
import mapData from "../assets/sichuan";//引入四川的json数据
export default {
name: "mapComponent",
data() {
return {};
},
methods: {},
mounted() {
//因为我在main.js全局引入了,所以用----------this.$echarts
//如果只在当前页面用,就用上面的import------- $echarts
this.$echarts.registerMap("sichaun", mapData); //mapData是定义的四川数据初始化
var chart = this.$echarts.init(document.getElementById("mapSelf"));
chart.setOption({
tooltip: {
trigger: "item",
formatter: "{b}"
},
series: [
{
type: "map",
map: "sichaun",
aspectScale: 0.75, //长宽比
data: [//这个是每个市的数据
{ name: "成都市", code: "1234" },
{ name: "雅安市", code: "234" ,},
{ name: "德阳市", code: "634" },
{ name: "资阳市", code: "934" },
{ name: "乐山市", code: "2234" }
],
label: {
normal: {
show: true,
textStyle: {
color: "#999", //文字颜色
fontSize: 12
}
},
emphasis: {
show: true,
textStyle: {
color: "#fff", //鼠标hover文字颜色
fontSize: 12
}
}
},
itemStyle: {
normal: {
areaColor: "#323c48", //整个背景填充颜色
borderColor: "dodgerblue" //边界颜色
},
emphasis: {
areaColor: "darkorange" //鼠标hover颜色
}
}
}
]
});
// 点击每个市所获取到的值,这里可进行相关操作
chart.on("click", function(params) {
console.log(params);
});
window.addEventListener("resize", function() {
chart.resize();
});
}
};
</script>
<style scoped>
.mapCont {
width: 600px;
height: 600px;
}
#mapSelf {
width: 100%;
height: 100%;
}
</style>
//全局引入main.js
//import echarts from 'echarts'
//Vue.prototype.$echarts = echarts