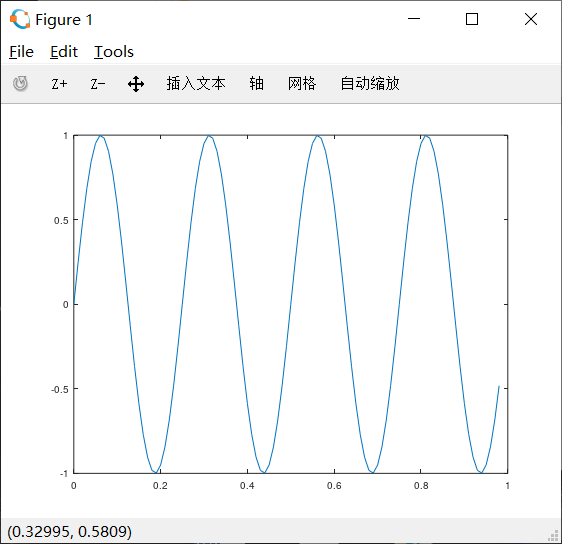
>> t = [0:0.01:0.98];
>> y1 = sin(2*pi*4*t);
>> plot(t, y1);
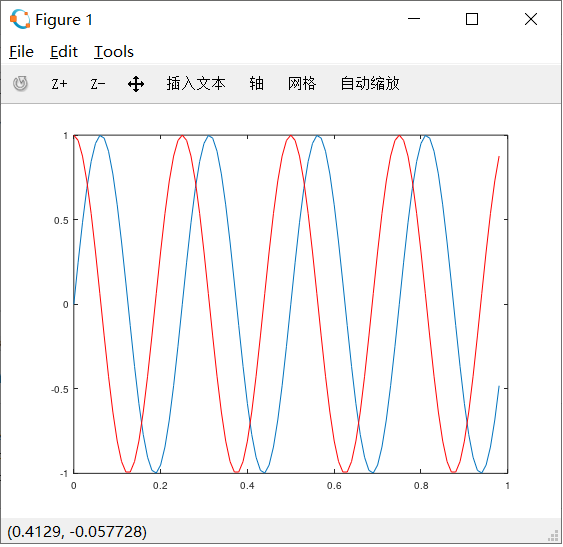
hold on 在原来的图片上继续绘制
>> y2 = cos(2*pi*4*t);
>> hold on;
>> plot(t, y2, 'r'); % ‘r’ 红色
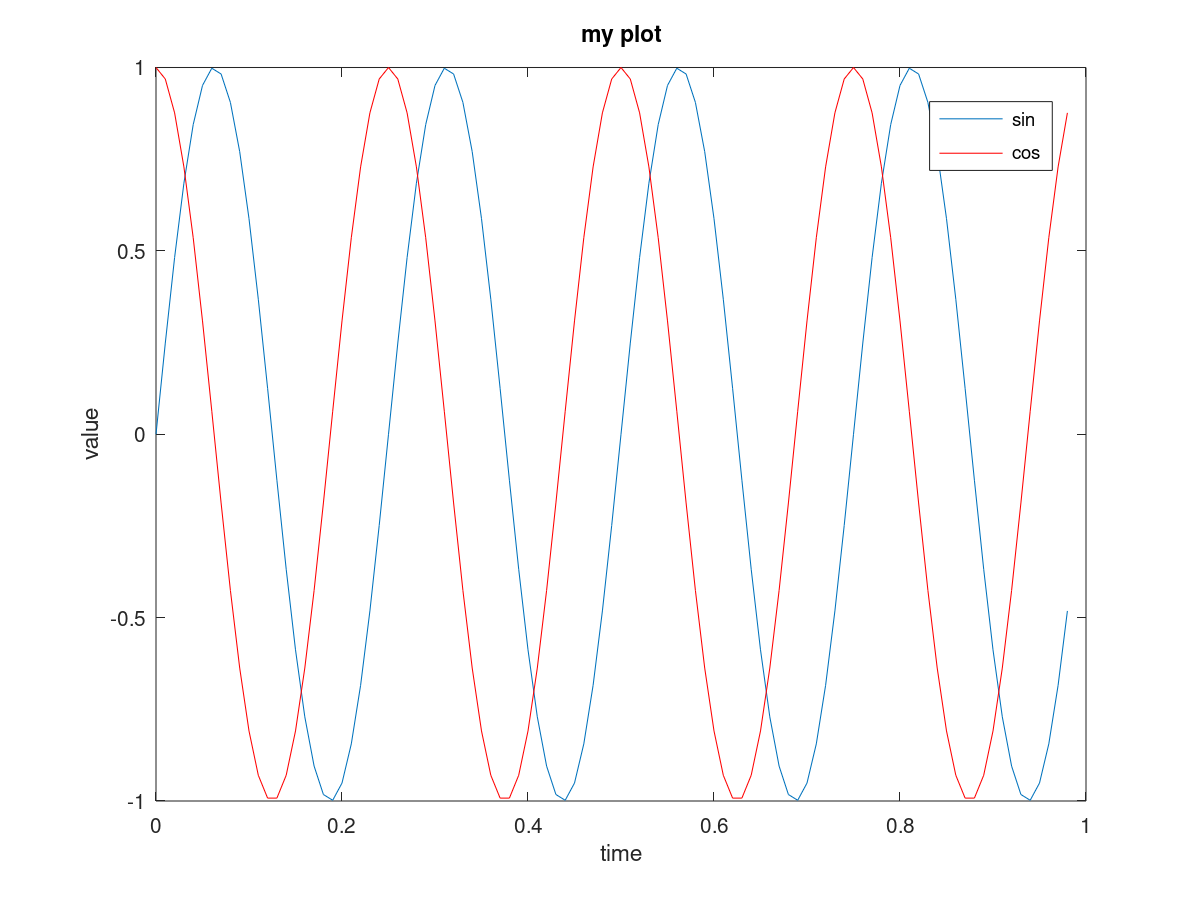
添加标签
>> xlabel('time')
>> ylabel('value')
>> legend('sin', 'cos') % 标识数据
>> title('my plot') % 图片名称
>> print -dpng 'myplot.png' % 保存图片到当前目录
将数据显示在不同的图片上
>> figure(1);plot(t, y1);
>> figure(2);plot(t, y2);
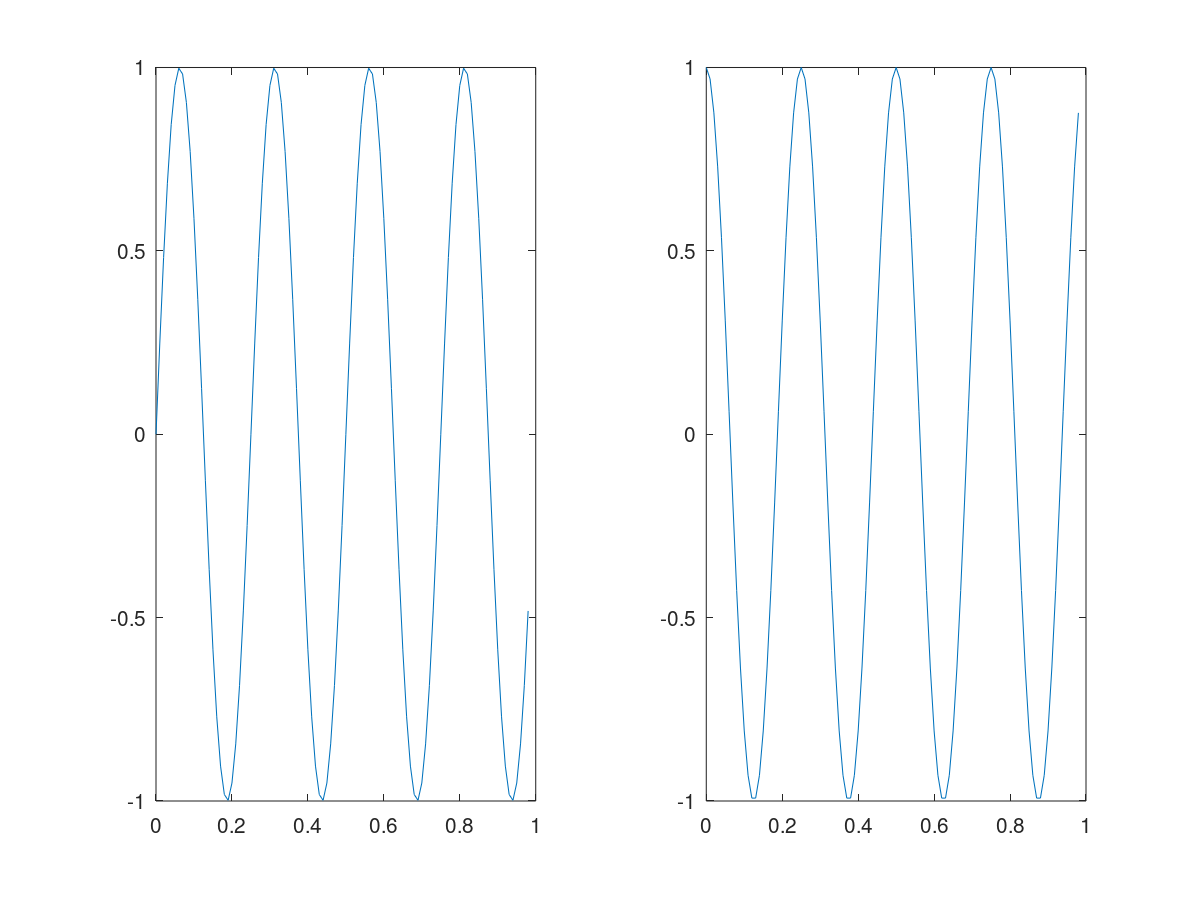
分割图像subplot(a, b, c), a,b 将图像分割为a * b 的图像,c控制使用第几个图像
>> subplot(1,2,1)
>> plot(t,y1)
>> subplot(1,2,2)
>> plot(t,y2)
调整坐标轴的范围axis()
具体可以看 help axis
clf 清除图像
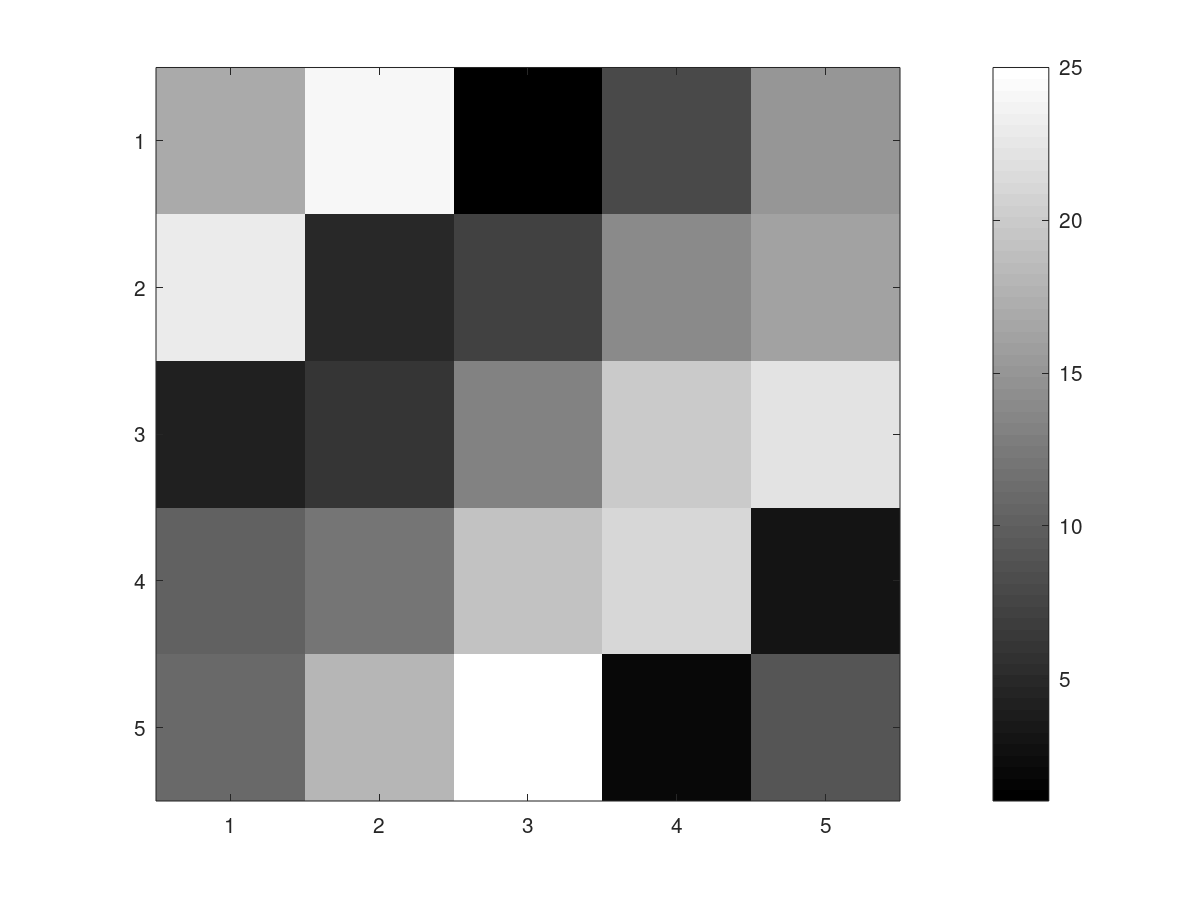
可视化矩阵
imagesc(A)
colorbar添加比对条
colormap gray 灰度化