Bokeh是一个专门针对Web浏览器的呈现功能的交互式可视化Python库。这是Bokeh与其它可视化库最核心的区别。
-
专门针对Web浏览器的交互式、可视化Python绘图库
-
可以做出像D3.js简洁漂亮的交互可视化效果,但是使用难度低于D3.js。
-
独立的HTML文档或服务端程序
-
可以处理大量、动态或数据流
-
支持Python (或Scala, R, Julia…)
-
不需要使用Javascript
Bokeh接口
-
Charts: 高层接口,以简单的方式绘制复杂的统计图
-
Plotting: 中层接口,用于组装图形元素
-
Models: 底层接口,为开发者提供了最大的灵活性

包引用from bokeh.io import output_notebook, output_file, showfrom bokeh.charts import Scatter, Bar, BoxPlot, Chordfrom bokeh.layouts import rowimport seaborn as snsexercise = sns.load_dataset('exercise')output_notebook()
-
from bokeh.io import output_file 生成.html文档
-
from boken.io import output_notebook 在jupyter中使用
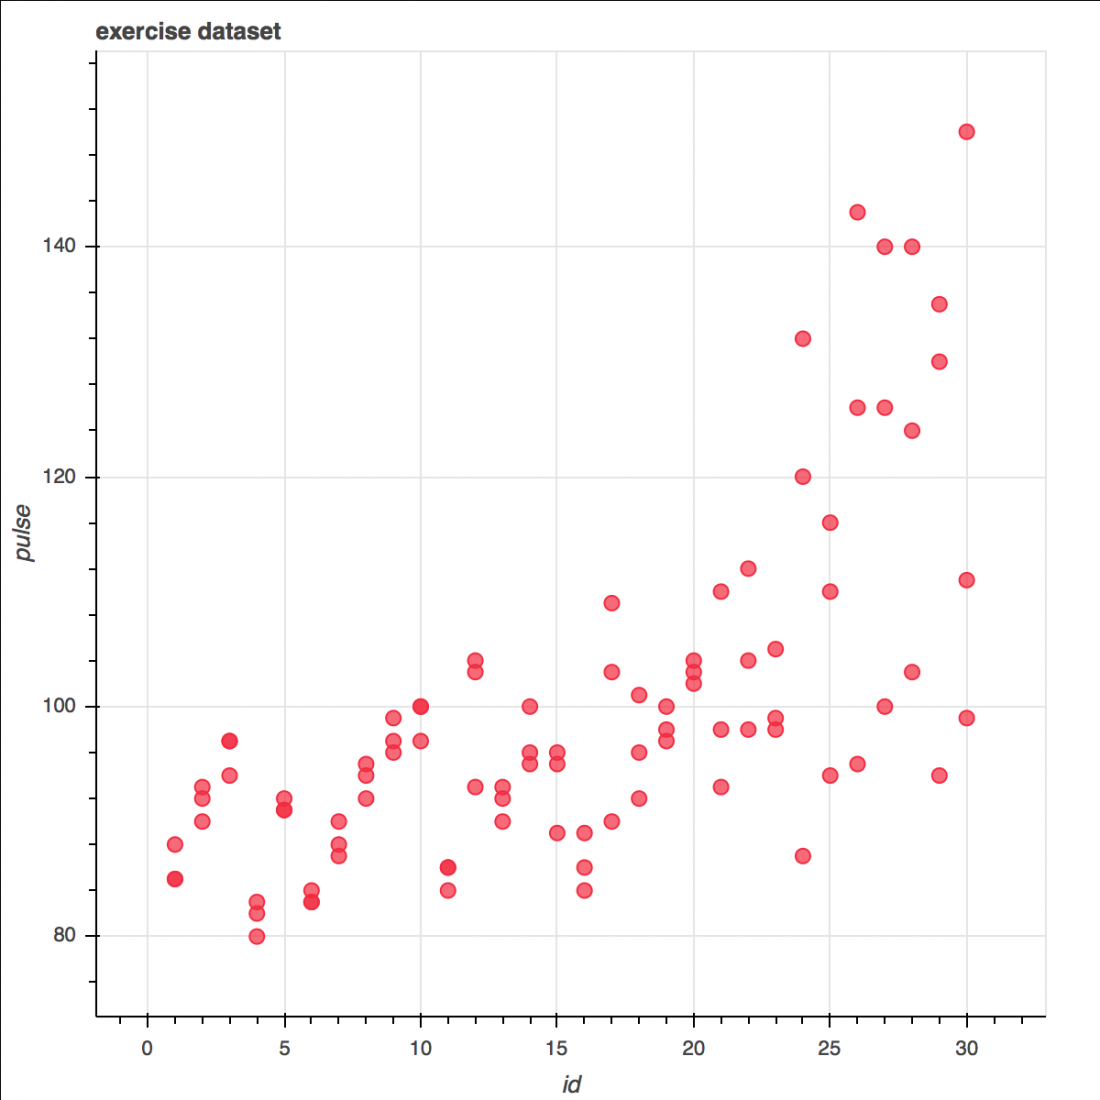
散点图 Scatter
# 散点图p = Scatter(data=exercise, x='id', y='pulse', title='exercise dataset')show(p)

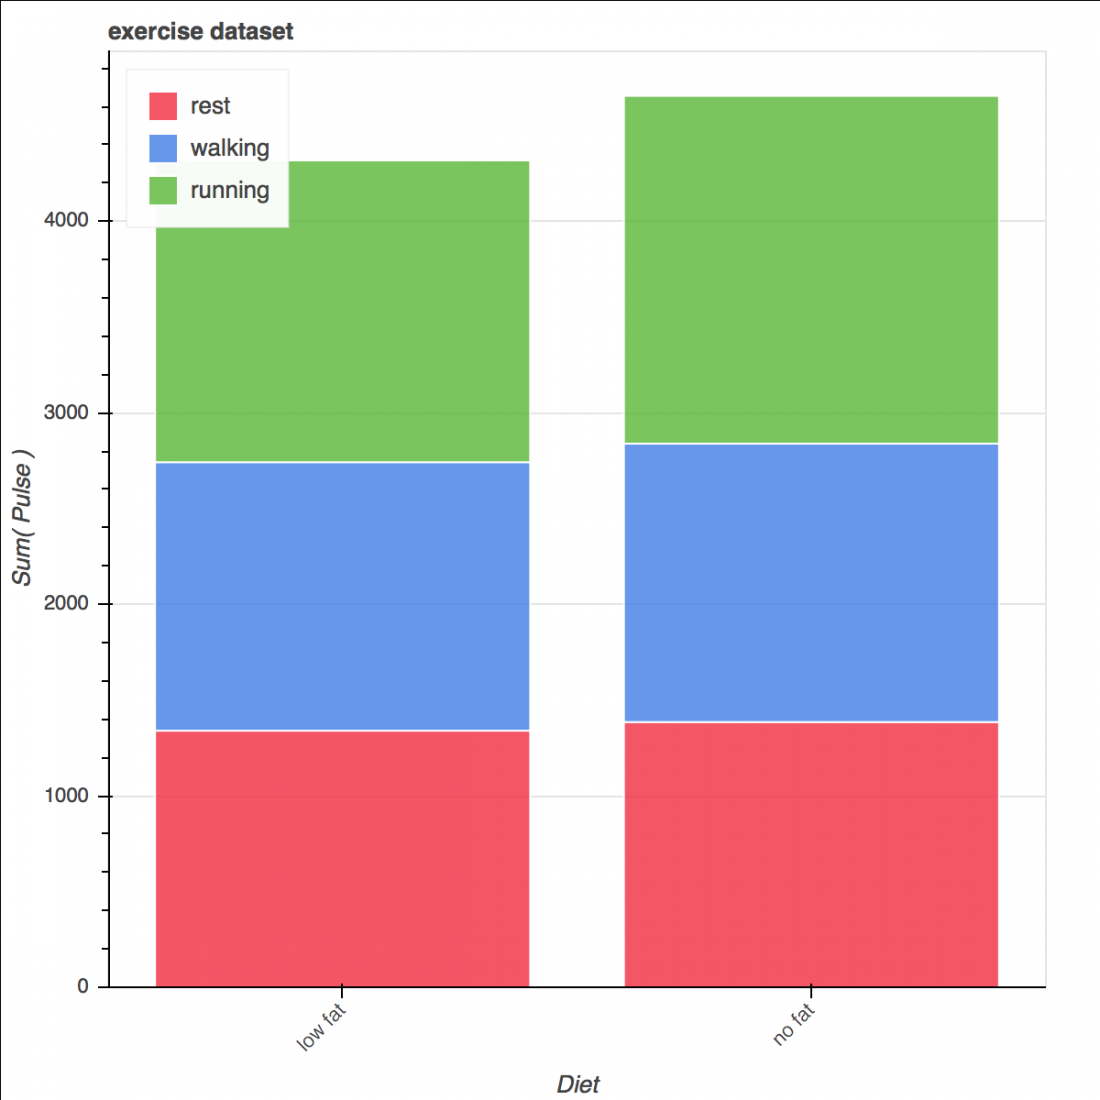
柱状图 Bar
# 柱状图p = Bar(data=exercise, values='pulse', label='diet', stack='kind', title='exercise dataset')show(p)

盒子图 BoxPlot
# 盒子图box1 = BoxPlot(data=exercise, values='pulse', label='diet', color='diet', title='exercise dataset')box2 = BoxPlot(data=exercise, values='pulse', label='diet', stack='kind', color='kind', title='exercise dataset')show(row(box1, box2))


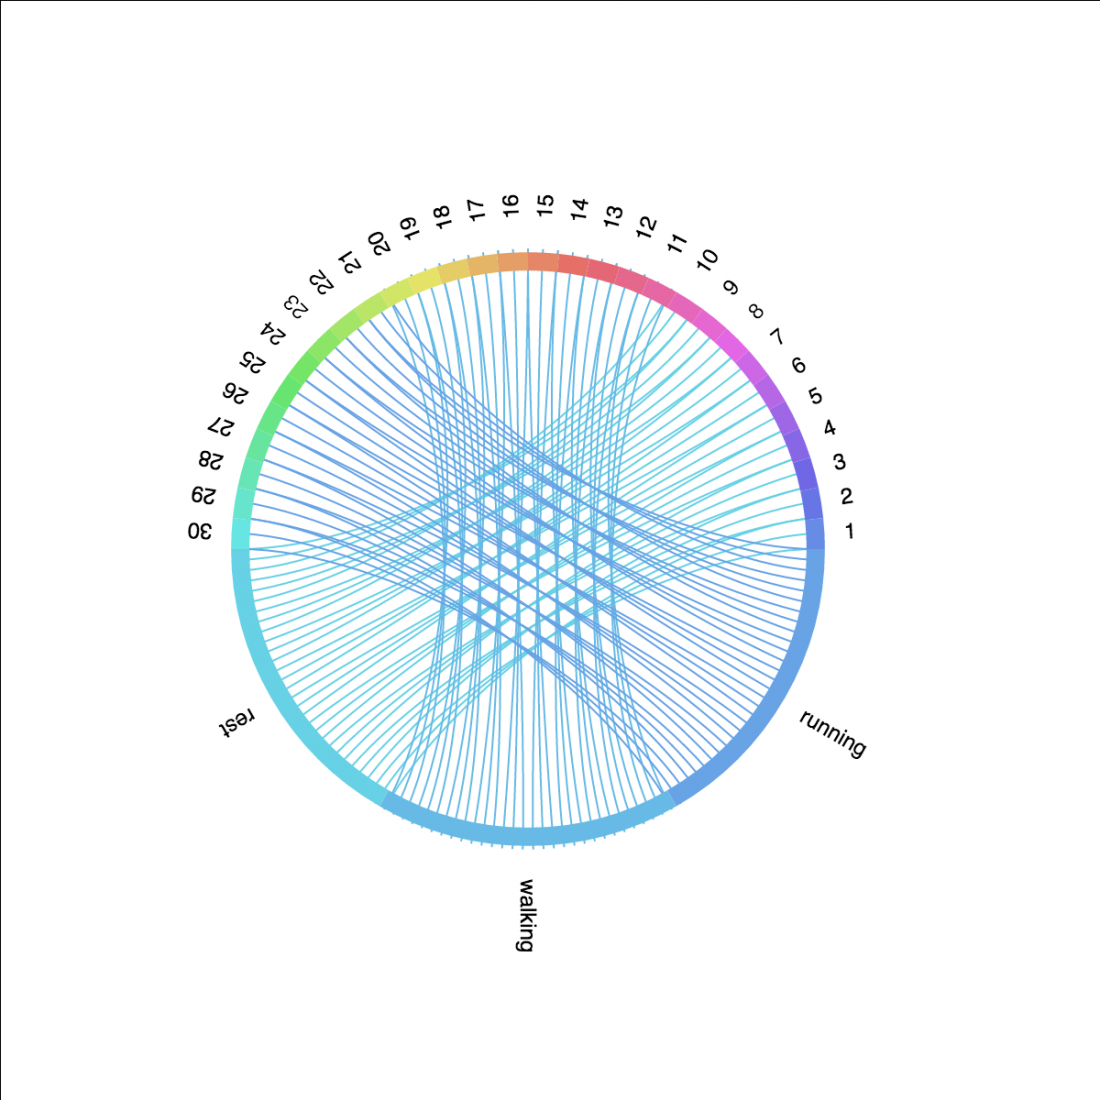
<ignore_js_op> 弦图 Chord
# 弦图 Chordchord1 = Chord(data=exercise, source="id", target="kind")chord2 = Chord(data=exercise, source="id", target="kind", value="pulse")show(row(chord1, chord2))


<ignore_js_op>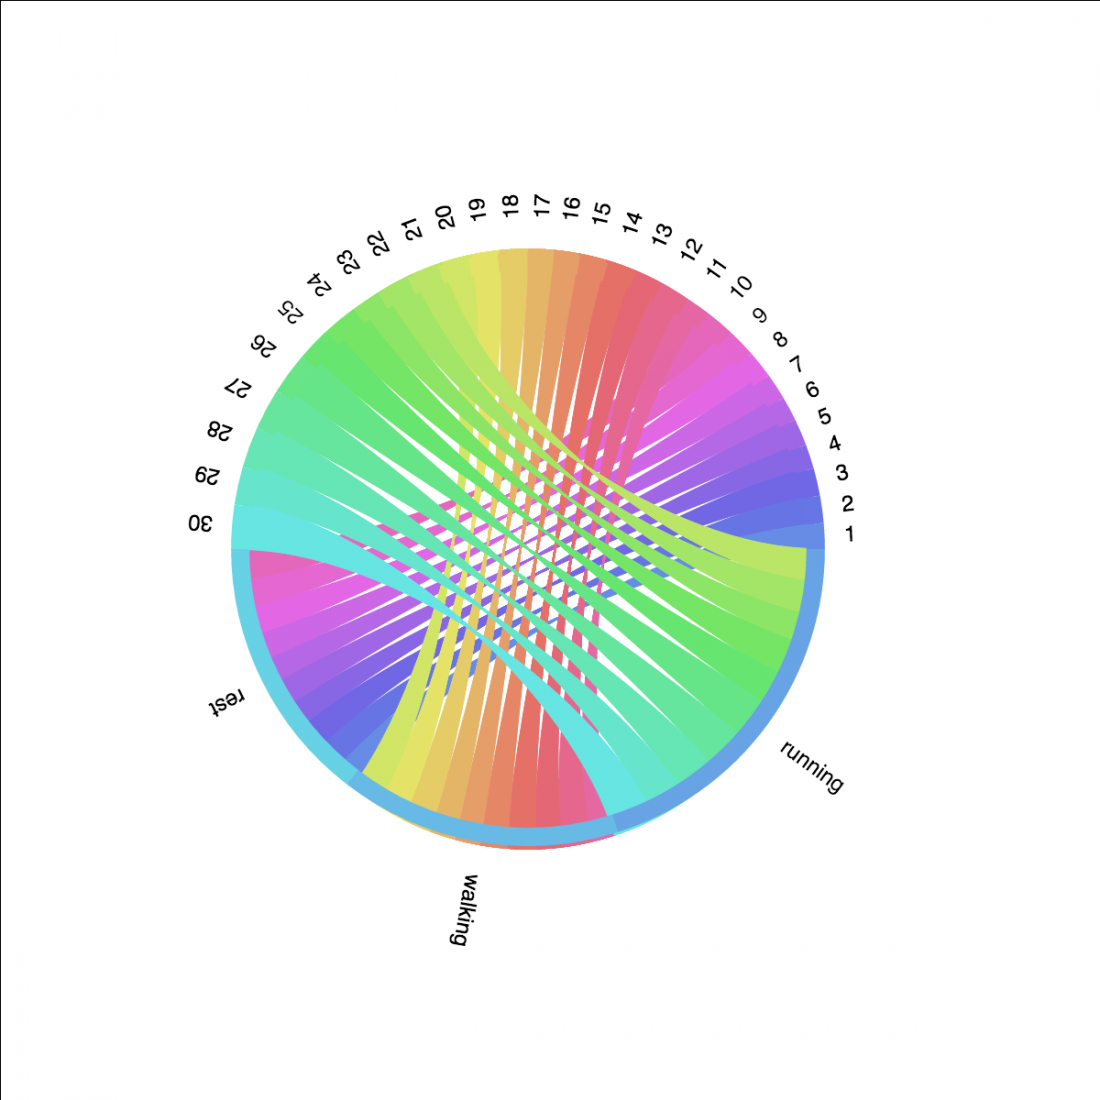 bokeh.plotting方框 square, 圆形 circle
from bokeh.plotting import figureimport numpy as npp = figure(plot_width=400, plot_height=400)# 方框p.square(np.random.randint(1,10,5), np.random.randint(1,10,5), size=20, color="navy")# 圆形p.circle(np.random.randint(1,10,5), np.random.randint(1,10,5), size=10, color="green")show(p)

<ignore_js_op>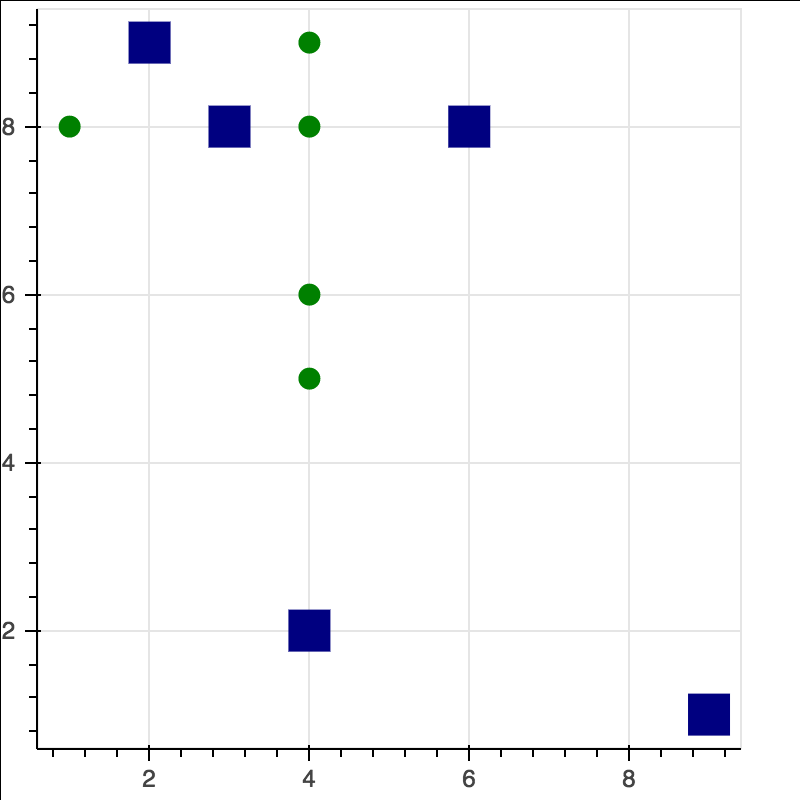
更多技术资讯可关注:gzitcast