ELK日志平台系统安装
一、下载elk
[root@host-47-98-97-124 ~]# wget https://artifacts.elastic.co/downloads/elasticsearch/elasticsearch-5.6.0.tar.gz
[root@host-47-98-97-124 ~]# wget https://artifacts.elastic.co/downloads/logstash/logstash-5.6.0.rpm
[root@host-47-98-97-124 ~]# wget https://artifacts.elastic.co/downloads/kibana/kibana-5.6.0-x86_64.rpm
二、jdk安装
[root@host-47-98-97-124 tools]# yum install jdk-8u91-linux-x64.rpm -y
[root@host-47-98-97-124 tools]# java -version
java version “1.8.0_91”
Java(TM) SE Runtime Environment (build 1.8.0_91-b14)
Java HotSpot(TM) 64-Bit Server VM (build 25.91-b14, mixed mode)
三、elasticsearch集群安装
注:分别在两个节点安装elasticsearch及jdk
3.1 软件安装
[root@host-47-98-97-124 ~]# wget https://artifacts.elastic.co/downloads/elasticsearch/elasticsearch-5.6.0.tar.gz
[root@host-47-98-97-124 ~]# tar axf elasticsearch-5.6.0.tar.gz -C /usr/local/
[root@host-47-98-97-124 ~]# mv /usr/local/elasticsearch-5.6.0 /usr/local/elasticsearch
3.2 创建ES用户和组
[root@host-47-98-97-124 ~]# groupadd elasticsearch
[root@host-47-98-97-124 ~]# useradd elasticsearch -g elasticsearch
3.3 创建数据目录及日志目录
[root@host-47-98-97-124 ~]# mkdir /usr/local/elasticsearch/data
[root@host-47-98-97-124 ~]# mkdir /usr/local/elasticsearch/logs
[root@host-47-98-97-124 ~]# chown -R elasticsearch:elasticsearch /usr/local/elasticsearch/
3.4 修改jvm空间分配(默认是2g)
[root@host-47-98-97-124 ~]# vi /usr/local/elasticsearch/config/jvm.options
注:由于阿里云ECS服务器的内存只有2g大小,所以需要重新修改jvm空间大小
-Xms1024m
-Xmx1024m
3.5 修改elasticsearch.yml配置
[root@host-47-98-97-124 ~]# vi /usr/local/elasticsearch/config/elasticsearch.yml
47.98.97.124
[root@host-47-98-97-124 ~]# egrep -Ev “^$|^#” /usr/local/elasticsearch/config/elasticsearch.yml
cluster.name: es-cluster
node.name: es-node1
node.master: true
node.data: true
path.data: /usr/local/elasticsearch/data
path.logs: /usr/local/elasticsearch/logs
network.host: 0.0.0.0 #表示此节点接口监听的地址,最后监听在0.0.0.0,所以其它节点就都可以访问他
network.publish_host: 47.98.97.124
http.port: 9200
discovery.zen.ping.unicast.hosts: [“47.98.97.124”, “47.106.141.17”] #表示集群用于主节点的发现地址,这里需要注意的是,配置的IP不只是单纯的节点发现,而是用于主节点的发现
http.cors.enabled: true
http.cors.allow-origin: “*” #增加新的参数,这样head插件可以访问es
47.106.141.17
[root@host-47-106-141-17 ~]# egrep -Ev “^$|^#” /usr/local/elasticsearch/config/elasticsearch.yml
cluster.name: es-cluster
node.name: es-node2
node.master: false
node.data: true
path.data: /usr/local/elasticsearch/data
path.logs: /usr/local/elasticsearch/logs
network.host: 0.0.0.0
network.publish_host: 47.106.141.17
http.port: 9200
discovery.zen.ping.unicast.hosts: [“47.98.97.124”, “47.106.141.17”]
discovery.zen.minimum_master_nodes: 1
http.cors.enabled: true
http.cors.allow-origin: “*”
注:
1.为了能够使用外网进行访问我们es服务,network.host: 0.0.0.0
2.阿里云服务器默认有安全组策略,如果修改安全组策略
3.关闭防火墙,systemctl stop firewalld
只有满足了这三个条件,es才能对外访问
4.https://www.ibm.com/support/knowledgecenter/zh/SSFPJS_8.5.6/com.ibm.wbpm.main.doc/topics/rfps_esearch_configoptions.html
3.6 修改系统参数配置
max number of threads [2048] for user [elasticsearch] is too low, increase to at least [4096]
* soft nproc 4096
root soft nproc unlimited
max file descriptors [65535] for elasticsearch process is too low, increase to at least [65536]
临时生效:[root@host-47-98-97-124 ~]# ulimit -n 165536
永久生效:[root@host-47-98-97-124 ~]# vi /etc/security/limits.conf
root soft nofile 165535
root hard nofile 165535
* soft nofile 165535
* hard nofile 165535
重启才生效,建议设置永久生效
max virtual memory areas vm.max_map_count [65530] is too low, increase to at least [262144]
[root@host-47-98-97-124 ~]# echo “vm.max_map_count=262144” >>/etc/sysctl.conf
[root@host-47-98-97-124 ~]# sysctl -p
3.7 启动elasticsearch服务
[root@host-47-98-97-124 ~]# su elasticsearch
[elasticsearch@host-47-98-97-124 root]$ /usr/local/elasticsearch/bin/elasticsearch -
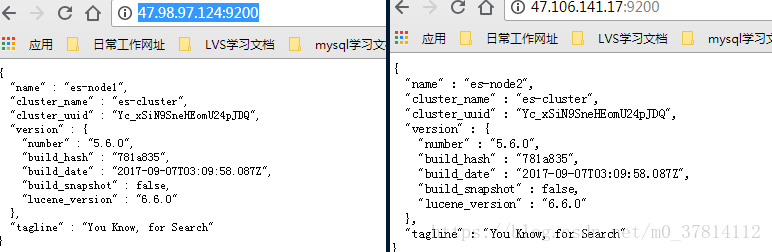
四、浏览器测试
五、head插件安装(单节点安装)
5.1 安装git,下载head插件
[root@host-47-98-97-124 ~]# yum instal git -y
[root@host-47-98-97-124 ~]# git clone git://github.com/mobz/elasticsearch-head.git
Cloning into ‘elasticsearch-head’…
remote: Counting objects: 4224, done.
remote: Total 4224 (delta 0), reused 0 (delta 0), pack-reused 4224
Receiving objects: 100% (4224/4224), 2.16 MiB | 556.00 KiB/s, done.
Resolving deltas: 100% (2329/2329), done.
5.2 安装node、npm、grunt
[root@host-47-98-97-124 ~]# wget https://nodejs.org/dist/v8.9.4/node-v8.9.4-linux-x64.tar.xz –no-check-certificate
下载下来的jar包是xz格式的,一般的linux可能不识别,还需要安装xz
[root@host-47-98-97-124 ~]# yum install xz -y
[root@host-47-98-97-124 ~]# xz -d node-v8.9.4-linux-x64.tar.xz
[root@host-47-98-97-124 ~]# tar -axf node-v8.9.4-linux-x64.tar
[root@host-47-98-97-124 ~]# vi /etc/profile
export NODE_HOME=/root/node-v8.9.4-linux-x64
export PATH=
NODE_HOME/bin
[root@host-47-98-97-124 ~]# source /etc/profile
这个时候可以测试一下node是否生效:
[root@host-47-98-97-124 ~]# echo $NODE_HOME
/root/node-v8.9.4-linux-x64
[root@host-47-98-97-124 ~]# node -v
v8.9.4
[root@host-47-98-97-124 ~]# npm -v
5.6.0
grunt是一个很方便的构建工具,可以进行打包压缩、测试、执行等等的工作,5.0以后的版本里的head插件就是通过grunt启动的。因此需要安装一下grunt
[root@host-47-98-97-124 ~]# npm install -g grunt-cli
/root/node-v8.9.4-linux-x64/bin/grunt -> /root/node-v8.9.4-linux-x64/lib/node_modules/grunt-cli/bin/grunt
+ [email protected]
added 16 packages in 8.227s
[root@host-47-98-97-124 ~]# grunt -version
grunt-cli v1.2.0
5.3 npm 安装依赖
到elasticsearch-head目录下,运行命令:
[root@host-47-98-97-124 ~]# cd elasticsearch-head/
[root@host-47-98-97-124 elasticsearch-head]# npm install
如果速度较慢或者安装失败,可以使用国内镜像:
[root@i-tviv8vaw elasticsearch-head]# npm install -g cnpm –registry=https://registry.npm.taobao.org
5.4 修改head源码
由于head的代码还是2.6版本的,直接执行有很多限制,比如无法跨机器访问。因此需要用户修改两个地方:
修改服务器监听地址,增加hostname属性,设置为*
[root@host-47-98-97-124 elasticsearch-head]# vi /root/elasticsearch-head/Gruntfile.js
connect: {
server: {
options: {
hostname: ‘*’,
port: 9100,
base: ‘.’,
keepalive: true
}
}
}
修改连接地址
[root@host-47-98-97-124 elasticsearch-head]# vi /root/elasticsearch-head/_site/app.js
修改前
this.base_uri = this.config.base_uri || this.prefs.get(“app-base_uri”) || “http://localhost:9200“;
修改后
this.base_uri = this.config.base_uri || this.prefs.get(“app-base_uri”) || “http://47.98.97.124:9200“;
注:把localhost修改成你elasticsearch的服务器地址
5.5 修改Elasticsearch配置文件
[root@host-47-98-97-124 elasticsearch-head]# vi /usr/local/elasticsearch/config/elasticsearch.yml
http.cors.enabled: true
http.cors.allow-origin: “*”
注:
http.cors.enabled: true 如果启用了 HTTP 端口,那么此属性会指定是否允许跨源 REST 请求
http.cors.allow-origin: “*” 如果 http.cors.enabled 的值为 true,那么该属性会指定允许 REST 请求来自何处
5.6 运行head
首先开启elasticsearch服务
然后在head目录中,执行npm install 下载以来的包:
npm install 最后,启动nodejs
grunt server
[root@host-47-98-97-124 elasticsearch-head]# pwd
/root/elasticsearch-head
[root@host-47-98-97-124 elasticsearch-head]# npm install
[root@host-47-98-97-124 elasticsearch-head]# nohup grunt server &
如果报错:
npm ERR! code ELIFECYCLE
npm ERR! errno 1
npm ERR! [email protected] install: node install.js
npm ERR! Exit status 1
npm ERR!
npm ERR! Failed at the [email protected] install script.
npm ERR! This is probably not a problem with npm. There is likely additional logging output above.
解决方法:
[root@host-47-98-97-124 elasticsearch-head]# npm install [email protected] –ignore-scripts
参考url:https://blog.csdn.net/z1035075390/article/details/73247412
[root@host-47-98-97-124 elasticsearch-head]# nohup grunt server &
[1] 20027
5.7 测试
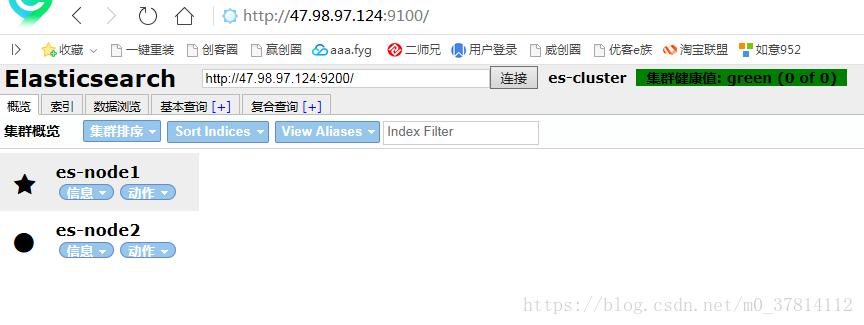
发现用谷歌浏览器竟然显示集群状态未连接,用360浏览器竟然正常,很奇怪!!!
六、logstash安装
官网:https://www.elastic.co/guide/en/logstash/5.6/index.html
6.1 安装logstash
[root@host-47-98-97-124 elk]# yum install logstash-5.6.6.rpm -y
[root@host-47-98-97-124 elk]# rpm -qc logstash
/etc/logstash/jvm.options
/etc/logstash/log4j2.properties
/etc/logstash/logstash.yml
/etc/logstash/startup.options
6.2 检查jvm空间
[root@host-47-98-97-124 elk]# vi /etc/logstash/jvm.options
注:防止物理内存过小导致logstash服务无法启动成功
6.3 测试:将数据写入标准输出
[root@host-47-98-97-124 elk]# /usr/share/logstash/bin/logstash -e ‘input { stdin {} } output { stdout {codec => rubydebug } }’
The stdin plugin is now waiting for input:
hello,world!
{
“@version” => “1”,
“host” => “host-47-98-97-124”,
“@timestamp” => 2018-07-21T15:10:46.140Z,
“message” => “zhangjunchao”
}
注:https://www.elastic.co/guide/en/logstash/5.6/running-logstash-command-line.html
测试:将数据写入elasticsearch里面,可以通过访问head插件可以查询数据
[root@host-47-98-97-124 elk]# /usr/share/logstash/bin/logstash -e ‘input { stdin{} } output { elasticsearch {hosts => [“47.98.97.124:9200”]} stdout{codec => rubydebug} }’
The stdin plugin is now waiting for input:
hello,word!
{
“@version” => “1”,
“host” => “host-47-98-97-124”,
“@timestamp” => 2018-07-21T15:27:32.858Z,
“message” => “zhangjunchao”
}
注:
1. 命令行中使用了-e参数,该参数允许Logstash直接通过命令行接受设置。这点尤其快速的帮助我们反复的测试配置是否正确而不用写配置文件
2. 合理设置logstash的jvm内存大小,即/etc/logstash/jvm.options
3. Logstash进来的数据不叫行,叫事件,logstash可以处理多行数据
4. Logstash5.6.0版本,Output plugins里面的elasticsearch插件,定义hosts与之前的版本有较大区别,具体可参考官网logstash5.1.2版本定义elasticsearch的参数定义规则
七、kibana安装
7.1 安装kibana
[root@host-47-98-97-124 elk]# yum install kibana-5.6.0-x86_64.rpm -y
[root@host-47-98-97-124 elk]# rpm -qc kibana
/etc/kibana/kibana.yml
7.2 配置kibana
[root@host-47-98-97-124 elk]# vi /etc/kibana/kibana.yml
[root@host-47-98-97-124 elk]# egrep -Ev “^#|^$” /etc/kibana/kibana.yml
server.port: 5601
server.host: “0.0.0.0” #阿里云使用公网访问必须改成0.0.0.0
elasticsearch.url: “http://47.98.97.124:9200”
kibana.index: “.kibana” #创建一个kibana索引,不需要专门对kibana的数据进行存放
elasticsearch.ssl.verify: false
注:
1.阿里云使用公网访问必须改成0.0.0.0
2.阿里云使用公网访问一定要配置安全组,放行访问端口及IP
7.3 后台启动kibana服务
[root@host-47-98-97-124 elk]# /usr/share/kibana/bin/kibana &
7.4 启动登录
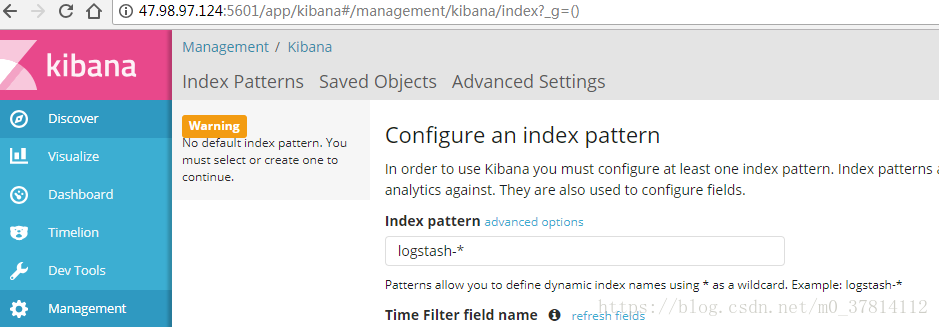
至此,kibana就初步安装完成!