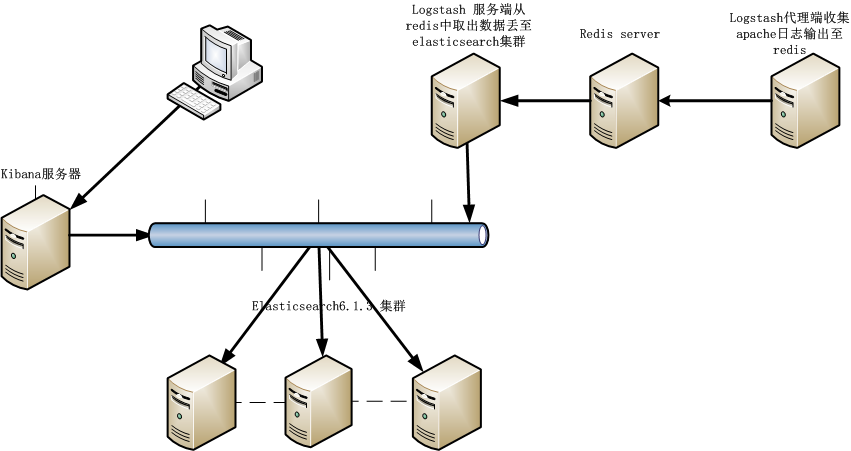
简单拓扑图
| IP | HOSTNAME | 运行服务 |
| 9.1.6.140 | ES1 | Kibana6.1.3 分析展示 Elasticsearch6.1.3 集群运算 Logstash6.1.3收集apache日志输出至redis |
| 9.1.8.123 | ES2 | Elasticsearch6.1.3集群运算 Redis3.2 消息发布订阅(接收logstash客户端的消息,推送至ES) |
| 9.1.8.153 | ES3 | Elasticsearch6.1.3集群运算 Logstash6.1.3(input来自redis的日志,output为elasticsearch服务器) |
一、下载redis简单安装用来存放logstash收集的数据
wget http://download.redis.io/releases/redis-3.2.11.tar.gz
[root@ AOS2 @AutoTest01:/root]#tar xvf redis-3.2.11.tar.gz -C /usr/local/

[root@ AOS2 @AutoTest01:/usr/local]#ln -sv redis-3.2.11 redis
"redis" -> "redis-3.2.11"
[root@ AOS2 @AutoTest01:/usr/local]#cd redis

[root@ AOS2 @AutoTest01:/usr/local/redis]#make
......

启动
[root@ AOS2 @AutoTest01:/usr/local/redis/src]#./redis-server &
[1] 5701
[root@ AOS2 @AutoTest01:/usr/local/redis/src]#5701:C 08 Feb 17:19:59.985 # Warning: no config file specified, using the default config. In order to specify a config file use ./redis-server /path/to/redis.conf
                _._
           _.-``__ ''-._
      _.-``    `.  `_.  ''-._           Redis 3.2.11 (00000000/0) 64 bit
  .-`` .-```.  ```\/    _.,_ ''-._
 (    '      ,       .-`  | `,    )     Running in standalone mode
 |`-._`-...-` __...-.``-._|'` _.-'|     Port: 6379
 |    `-._   `._    /     _.-'    |     PID: 5701
  `-._    `-._  `-./  _.-'    _.-'
 |`-._`-._    `-.__.-'    _.-'_.-'|
 |    `-._`-._        _.-'_.-'    |           http://redis.io
  `-._    `-._`-.__.-'_.-'    _.-'
 |`-._`-._    `-.__.-'    _.-'_.-'|
 |    `-._`-._        _.-'_.-'    |
  `-._    `-._`-.__.-'_.-'    _.-'
      `-._    `-.__.-'    _.-'
          `-._        _.-'
              `-.__.-'

5701:M 08 Feb 17:19:59.987 # WARNING: The TCP backlog setting of 511 cannot be enforced because /proc/sys/net/core/somaxconn is set to the lower value of 128.
5701:M 08 Feb 17:19:59.987 # Server started, Redis version 3.2.11
5701:M 08 Feb 17:19:59.987 # WARNING overcommit_memory is set to 0! Background save may fail under low memory condition. To fix this issue add 'vm.overcommit_memory = 1' to /etc/sysctl.conf and then reboot or run the command 'sysctl vm.overcommit_memory=1' for this to take effect.
5701:M 08 Feb 17:19:59.987 # WARNING you have Transparent Huge Pages (THP) support enabled in your kernel. This will create latency and memory usage issues with Redis. To fix this issue run the command 'echo never > /sys/kernel/mm/transparent_hugepage/enabled' as root, and add it to your /etc/rc.local in order to retain the setting after a reboot. Redis must be restarted after THP is disabled.
5701:M 08 Feb 17:19:59.987 * DB loaded from disk: 0.000 seconds
5701:M 08 Feb 17:19:59.987 * The server is now ready to accept connections on port 6379
监听端口6379
[root@ AOS2 @AutoTest01:/root]#netstat -antlp |grep :6379
tcp        0      0 0.0.0.0:6379                0.0.0.0:*                   LISTEN      5701/./redis-server
tcp        0      0 :::6379                     :::*                        LISTEN      5701/./redis-server


[root@ AOS2 @AutoTest01:/usr/local/redis/src]#./redis-cli
127.0.0.1:6379> set foo bar
OK
127.0.0.1:6379> get foo
"bar"
127.0.0.1:6379>


OK可以简单使用了
二、配置logstash 为agent端为output 参考logstash output插件https://www.elastic.co/guide/en/logstash/5.5/index.html
logstash代理收集数据输出至redis服务器
[root@zdhdbbsj conf.d]# cat apachelog.conf
input {
    file {
	    path    => ["/var/log/httpd/access_log"]
	    type    => "apachelog"
	    start_position => "beginning"
	    }
	}

filter {
	  grok {
	   match => { "message" => "%{COMBINEDAPACHELOG}" }
	    }
	}
output {
	 redis {
		port	=> 6379
		host	=> ["9.1.8.123"]
		data_type	=> "list"
		db	=> 0
		key => "logstash-apachelog"
	}
}


[root@zdhdbbsj conf.d]# logstash -f ./apachelog.conf -t
Sending Logstash's logs to /var/log/logstash which is now configured via log4j2.properties
Configuration OK
访问apache网页,生成访问日志,查看redis上的数据
[root@ AOS2 @AutoTest01:/usr/local/redis/src]#./redis-cli

127.0.0.1:6379> LLEN logstash-apachelog
(integer) 20
127.0.0.1:6379> LINDEX logstash-apachelog 1
"{\"ident\":\"-\",\"@version\":\"1\",\"message\":\"9.5.7.222 - - [09/Feb/2018:10:13:21 +0800] \\\"GET / HTTP/1.1\\\" 403 3985 \\\"-\\\" \\\"Mozilla/4.0 (compatible; MSIE 7.0; Windows NT 10.0; WOW64; Trident/8.0; .NET4.0C; .NET4.0E; InfoPath.3)\\\"\",\"type\":\"apachelog\",\"auth\":\"-\",\"timestamp\":\"09/Feb/2018:10:13:21 +0800\",\"request\":\"/\",\"host\":\"zdhdbbsj\",\"verb\":\"GET\",\"httpversion\":\"1.1\",\"referrer\":\"\\\"-\\\"\",\"agent\":\"\\\"Mozilla/4.0 (compatible; MSIE 7.0; Windows NT 10.0; WOW64; Trident/8.0; .NET4.0C; .NET4.0E; InfoPath.3)\\\"\",\"bytes\":\"3985\",\"response\":\"403\",\"clientip\":\"9.5.7.222\",\"@timestamp\":\"2018-02-09T03:13:27.618Z\",\"path\":\"/var/log/httpd/access_log\"}"
127.0.0.1:6379>
127.0.0.1:6379> LINDEX logstash-apachelog 0
"{\"ident\":\"-\",\"@version\":\"1\",\"message\":\"9.5.7.222 - - [09/Feb/2018:10:13:13 +0800] \\\"GET / HTTP/1.1\\\" 304 - \\\"-\\\" \\\"Mozilla/4.0 (compatible; MSIE 7.0; Windows NT 10.0; WOW64; Trident/8.0; .NET4.0C; .NET4.0E; InfoPath.3)\\\"\",\"type\":\"apachelog\",\"auth\":\"-\",\"timestamp\":\"09/Feb/2018:10:13:13 +0800\",\"request\":\"/\",\"host\":\"zdhdbbsj\",\"verb\":\"GET\",\"httpversion\":\"1.1\",\"referrer\":\"\\\"-\\\"\",\"agent\":\"\\\"Mozilla/4.0 (compatible; MSIE 7.0; Windows NT 10.0; WOW64; Trident/8.0; .NET4.0C; .NET4.0E; InfoPath.3)\\\"\",\"response\":\"304\",\"clientip\":\"9.5.7.222\",\"@timestamp\":\"2018-02-09T03:13:27.613Z\",\"path\":\"/var/log/httpd/access_log\"}"
127.0.0.1:6379>
三、logstash配置为server端从redis读取数据发送elasticsearch或者集群
[root@zdhhamqb ~]# cat /etc/logstash/conf.d/server.conf
input {
	 redis {
		port	=> 6379
		host	=> ["9.1.8.123"]
		data_type	=> "list"
		db	=> 0
		key => "logstash-apachelog"
	}
}
output {
    elasticsearch {
		index => "logstash-%{+YYYY.MM.dd}"
        port	=> 9200
		host	=> ["9.1.8.153"]
            }

}
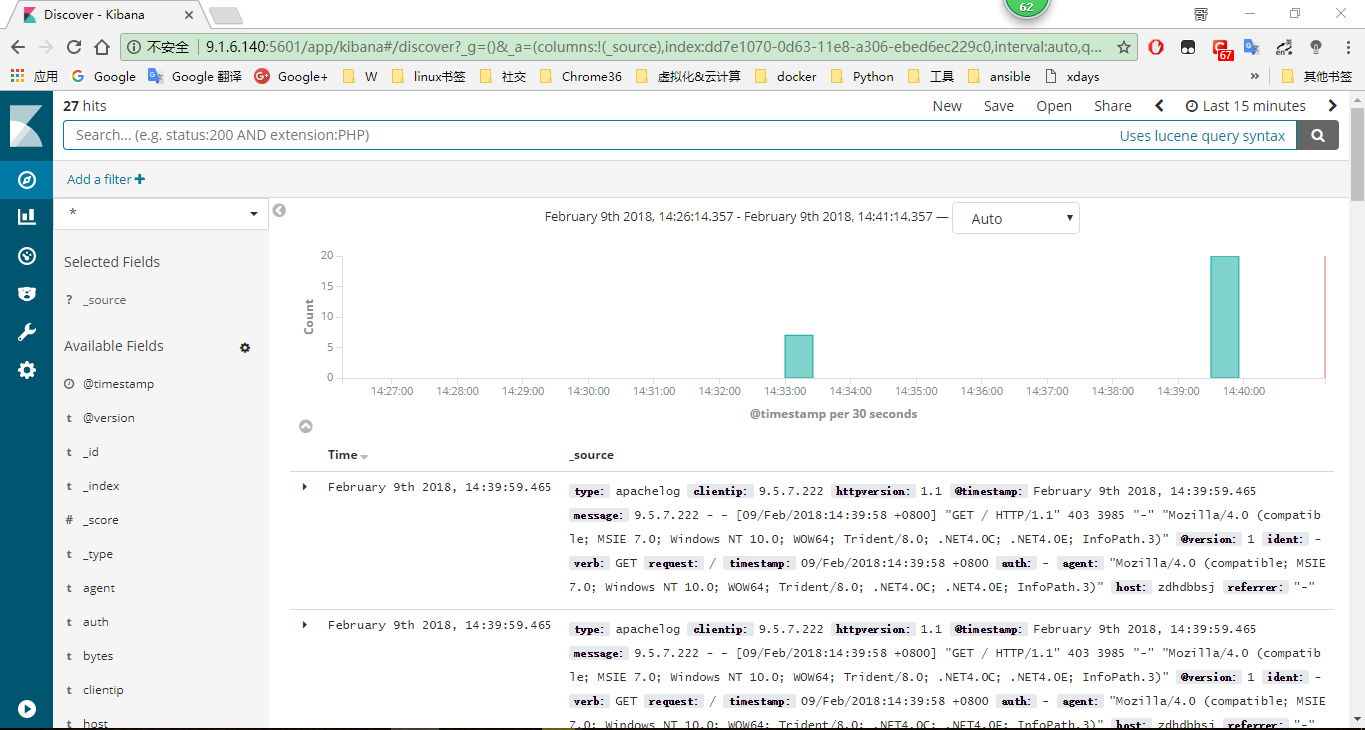
刷新apache日志查看ES里面得索引日志
[root@zdhhamqb ~]# curl  -XGET 'http://9.1.8.153:9200/_cat/indices'
green open logstash-2018.02.09 d_u4lgEHRDyQALLjiWwbIw 5 1 10 0 161.7kb 86.7kb
green open students            fdfkpZVmTOeCRTxmSJXFAA 5 1  2 0  23.6kb 11.8kb
[root@zdhhamqb ~]# curl  -XGET 'http://9.1.8.153:9200/logstash-2018.02.09/_search?pretty'
{
  "took" : 3,
  "timed_out" : false,
  "_shards" : {
    "total" : 5,
    "successful" : 5,
    "skipped" : 0,
    "failed" : 0
  },
  "hits" : {
    "total" : 10,
    "max_score" : 1.0,
    "hits" : [
      {
        "_index" : "logstash-2018.02.09",
        "_type" : "doc",
        "_id" : "LJXCeGEBXsK3Z7fytDfA",
        "_score" : 1.0,
        "_source" : {
          "type" : "apachelog",
          "clientip" : "9.5.7.222",
          "httpversion" : "1.1",
          "@timestamp" : "2018-02-09T04:13:06.800Z",
          "message" : "9.5.7.222 - - [09/Feb/2018:12:13:06 +0800] \"GET / HTTP/1.1\" 403 3985 \"-\" \"Mozilla/4.0 (compatible; MSIE 7.0; Windows NT 10.0; WOW64; Trident/8.0; .NET4.0C; .NET4.0E; InfoPath.3)\"",
          "@version" : "1",
          "ident" : "-",
          "verb" : "GET",
          "request" : "/",
          "timestamp" : "09/Feb/2018:12:13:06 +0800",
          "auth" : "-",
          "agent" : "\"Mozilla/4.0 (compatible; MSIE 7.0; Windows NT 10.0; WOW64; Trident/8.0; .NET4.0C; .NET4.0E; InfoPath.3)\"",
          "host" : "zdhdbbsj",
          "referrer" : "\"-\"",
          "bytes" : "3985",
          "response" : "403",
          "path" : "/var/log/httpd/access_log"
        }
      },
      {
        "_index" : "logstash-2018.02.09",
        "_type" : "doc",
        "_id" : "JpXCeGEBXsK3Z7fysDfU",
        "_score" : 1.0,
        "_source" : {
          "type" : "apachelog",
          "clientip" : "9.5.7.222",
          "httpversion" : "1.1",
          "@timestamp" : "2018-02-09T04:13:05.796Z",
          "message" : "9.5.7.222 - - [09/Feb/2018:12:13:05 +0800] \"GET / HTTP/1.1\" 403 3985 \"-\" \"Mozilla/4.0 (compatible; MSIE 7.0; Windows NT 10.0; WOW64; Trident/8.0; .NET4.0C; .NET4.0E; InfoPath.3)\"",
          "@version" : "1",
          "ident" : "-",
          "verb" : "GET",
          "request" : "/",
          "timestamp" : "09/Feb/2018:12:13:05 +0800",
          "auth" : "-",
          "agent" : "\"Mozilla/4.0 (compatible; MSIE 7.0; Windows NT 10.0; WOW64; Trident/8.0; .NET4.0C; .NET4.0E; InfoPath.3)\"",
          "host" : "zdhdbbsj",
          "referrer" : "\"-\"",
          "bytes" : "3985",
          "response" : "403",
          "path" : "/var/log/httpd/access_log"
        }
      },
安装kibana
wget https://artifacts.elastic.co/downloads/kibana/kibana-6.2.0-x86_64.rpm
rpm -ivh kibana-6.2.0-x86_64.rpm
配置
[root@zdhdbbsj ~]# grep -v '^#' /etc/kibana/kibana.yml  |grep -v '^$'
server.port: 5601
server.host: "9.1.6.140"
server.name: "zdhdbbsj"
elasticsearch.url: "http://9.1.6.140:9200"
启动
[root@zdhdbbsj ~]# /etc/init.d/kibana status
kibana is running
监听端口5601
[root@zdhdbbsj ~]# netstat -antlp |grep :5601
tcp        0      0 9.1.6.140:5601              0.0.0.0:*                   LISTEN      20044/node
[root@zdhdbbsj ~]#
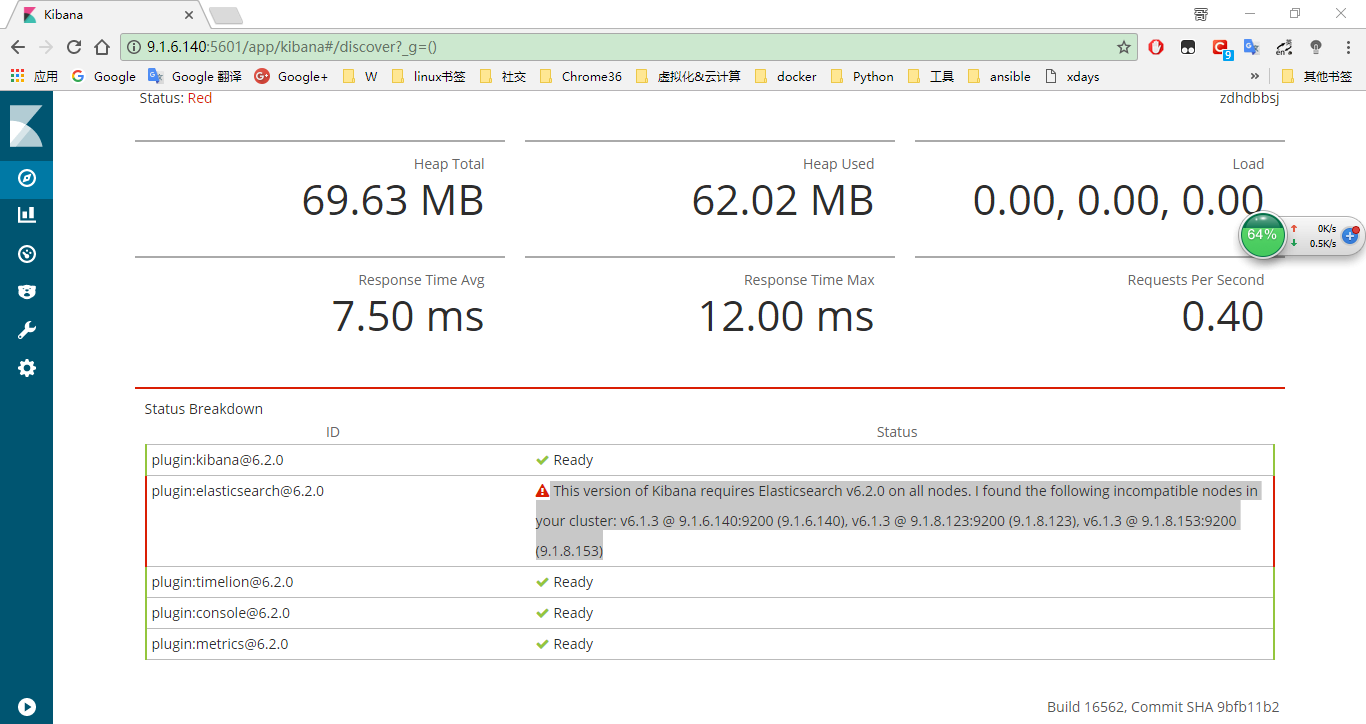
这个新版本的kibana好像不匹配
wget https://artifacts.elastic.co/downloads/kibana/kibana-6.1.3-x86_64.rpm
[root@zdhdbbsj ~]# rpm -ivh kibana-6.1.3-x86_64.rpm
warning: kibana-6.1.3-x86_64.rpm: Header V4 RSA/SHA512 Signature, key ID d88e42b4: NOKEY
Preparing...                ########################################### [100%]
   1:kibana                 ########################################### [100%]


[root@zdhdbbsj kibana]# tail -f /var/log/kibana/kibana.stdout
{"type":"response","@timestamp":"2018-02-09T06:21:54Z","tags":[],"pid":20044,"method":"get","statusCode":304,"req":{"url":"/ui/favicons/favicon-32x32.png","method":"get","headers":{"host":"9.1.6.140:5601","connection":"keep-alive","user-agent":"Mozilla/5.0 (Windows NT 10.0; Win64; x64) AppleWebKit/537.36 (KHTML, like Gecko) Chrome/63.0.3239.132 Safari/537.36","accept":"image/webp,image/apng,image/*,*/*;q=0.8","referer":"http://9.1.6.140:5601/app/kibana","accept-encoding":"gzip, deflate","accept-language":"zh-CN,zh;q=0.9,en;q=0.8","if-none-match":"\"8e183c2e644fb050707d89402e1f7a120a95e4d2\"","if-modified-since":"Thu, 01 Feb 2018 17:43:13 GMT"},"remoteAddress":"9.5.7.222","userAgent":"9.5.7.222","referer":"http://9.1.6.140:5601/app/kibana"},"res":{"statusCode":304,"responseTime":2,"contentLength":9},"message":"GET /ui/favicons/favicon-32x32.png 304 2ms - 9.0B"}
{"type":"response","@timestamp":"2018-02-09T06:21:54Z","tags":[],"pid":20044,"method":"get","statusCode":304,"req":{"url":"/ui/favicons/favicon-16x16.png","method":"get","headers":{"host":"9.1.6.140:5601","connection":"keep-alive","user-agent":"Mozilla/5.0 (Windows NT 10.0; Win64; x64) AppleWebKit/537.36 (KHTML, like Gecko) Chrome/63.0.3239.132 Safari/537.36","accept":"image/webp,image/apng,image/*,*/*;q=0.8","referer":"http://9.1.6.140:5601/app/kibana","accept-encoding":"gzip, deflate","accept-language":"zh-CN,zh;q=0.9,en;q=0.8","if-none-match":"\"13b869be5df4bdc56920edc16a28e67a7c08203b\"","if-modified-since":"Thu, 01 Feb 2018 17:43:13 GMT"},"remoteAddress":"9.5.7.222","userAgent":"9.5.7.222","referer":"http://9.1.6.140:5601/app/kibana"},"res":{"statusCode":304,"responseTime":1,"contentLength":9},"message":"GET /ui/favicons/favicon-16x16.png 304 1ms - 9.0B"}
{"type":"log","@timestamp":"2018-02-09T06:32:26Z","tags":["plugins","warning"],"pid":1001,"path":"/usr/share/kibana/src/core_plugins/vega","message":"Skipping non-plugin directory at /usr/share/kibana/src/core_plugins/vega"}
{"type":"log","@timestamp":"2018-02-09T06:32:27Z","tags":["status","plugin:[email protected]","info"],"pid":1001,"state":"green","message":"Status changed from uninitialized to green - Ready","prevState":"uninitialized","prevMsg":"uninitialized"}
{"type":"log","@timestamp":"2018-02-09T06:32:27Z","tags":["status","plugin:[email protected]","info"],"pid":1001,"state":"yellow","message":"Status changed from uninitialized to yellow - Waiting for Elasticsearch","prevState":"uninitialized","prevMsg":"uninitialized"}
{"type":"log","@timestamp":"2018-02-09T06:32:27Z","tags":["status","plugin:[email protected]","info"],"pid":1001,"state":"green","message":"Status changed from uninitialized to green - Ready","prevState":"uninitialized","prevMsg":"uninitialized"}
{"type":"log","@timestamp":"2018-02-09T06:32:27Z","tags":["status","plugin:[email protected]","info"],"pid":1001,"state":"green","message":"Status changed from yellow to green - Ready","prevState":"yellow","prevMsg":"Waiting for Elasticsearch"}
{"type":"log","@timestamp":"2018-02-09T06:32:27Z","tags":["status","plugin:[email protected]","info"],"pid":1001,"state":"green","message":"Status changed from uninitialized to green - Ready","prevState":"uninitialized","prevMsg":"uninitialized"}
{"type":"log","@timestamp":"2018-02-09T06:32:27Z","tags":["status","plugin:[email protected]","info"],"pid":1001,"state":"green","message":"Status changed from uninitialized to green - Ready","prevState":"uninitialized","prevMsg":"uninitialized"}
{"type":"log","@timestamp":"2018-02-09T06:32:27Z","tags":["listening","info"],"pid":1001,"message":"Server running at http://9.1.6.140:5601"}
访问http://9.1.6.140:5601