1、show processlist;
SHOW PROCESSLIST显示哪些线程正在运行。您也可以使用mysqladmin processlist语句得到此信息。如果您有SUPER权限,您可以看到所有线程。否则,您只能看到您自己的线程(也就是,与您正在使用的MySQL账户相关的线程)。如果有线程在update或者insert 某个表,此时进程的status为updating 或者 sending data。
如果您得到“too many connections”错误信息,并且想要了解正在发生的情况,本语句是非常有用的。MySQL保留一个额外的连接,让拥有SUPER权限的账户使用,以确保管理员能够随时连接和检查系统(假设您没有把此权限给予所有的用户)。
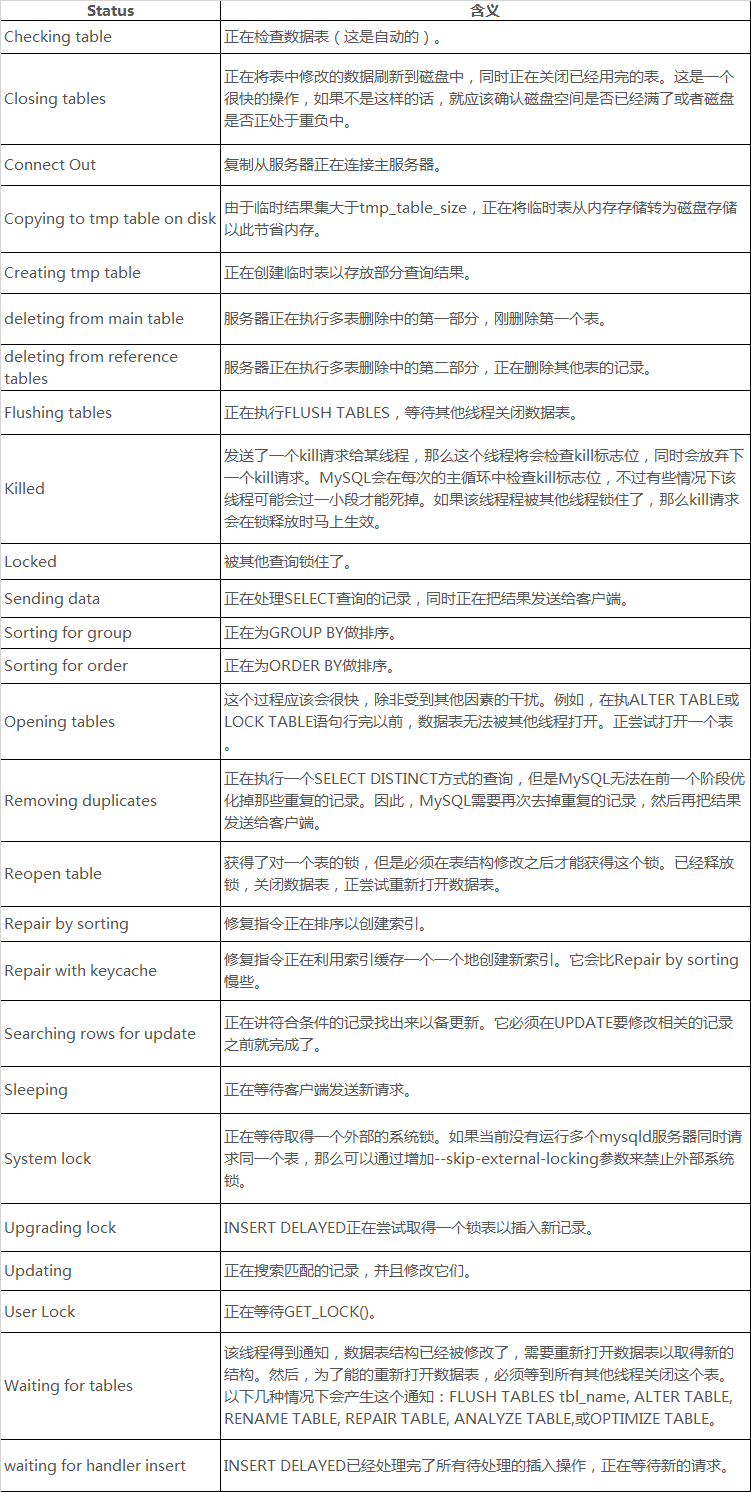
大部分状态对应很快的操作,只要有一个线程保持同一个状态好几秒钟,那么可能是有问题发生了,需要检查一下。还有其他的状态没在上面中列出来,不过它们大部分只是在查看服务器是否有存在错误是才用得着。
2、show full processlist;
show processlist;只列出前100条,如果想全列出请使用show full processlist;
3、show open tables;

mysql> show open tables from gongzhang_testx;
+-----------------+-----------------------------+--------+-------------+
| Database        | Table                       | In_use | Name_locked |
+-----------------+-----------------------------+--------+-------------+
| gongzhang_testx | gz_news                     |      0 |           0 |
| gongzhang_testx | gz_exam_sub_log             |      0 |           0 |
| gongzhang_testx | gz_chief_list_tmp           |      0 |           0 |
| gongzhang_testx | gz_comment                  |      0 |           0 |
| gongzhang_testx | gz_counsel                  |      0 |           0 |
| gongzhang_testx | gz_contract_jianli_pay      |      0 |           0 |
| gongzhang_testx | gz_focus                    |      0 |           0 |
| gongzhang_testx | gz_city                     |      0 |           0 |
| gongzhang_testx | gz_chief_goods_bss          |      0 |           0 |
这条命令能够查看当前有那些表是打开的。In_use列表示有多少线程正在使用某张表,Name_locked表示表名是否被锁,这一般发生在Drop或Rename命令操作这张表时。所以这条命令不能帮助解答我们常见的问题:当前某张表是否有死锁,谁拥有表上的这个锁等。这个列表可能特别长,你的屏幕估计都装不下。我遇到过,滚动条翻到最上面还是显示不了第一行,所以可以考虑使用客户端软件查看。或者通过指定数据库来减少返回条数:show open tables from database;
4、show status like ‘%lock%’
查看服务器状态。
mysql> show status like '%lock%';
+------------------------------------------+---------+
| Variable_name                            | Value   |
+------------------------------------------+---------+
| Com_lock_tables                          | 0       |
| Com_unlock_tables                        | 0       |
| Innodb_row_lock_current_waits            | 0       |
| Innodb_row_lock_time                     | 3946985 |
| Innodb_row_lock_time_avg                 | 1558    |
| Innodb_row_lock_time_max                 | 121788  |
| Innodb_row_lock_waits                    | 2532    |
| Key_blocks_not_flushed                   | 0       |
| Key_blocks_unused                        | 26716   |
| Key_blocks_used                          | 2660    |
| Performance_schema_locker_lost           | 0       |
| Performance_schema_rwlock_classes_lost   | 0       |
| Performance_schema_rwlock_instances_lost | 0       |
| Qcache_free_blocks                       | 27343   |
| Qcache_total_blocks                      | 61962   |
| Table_locks_immediate                    | 8504599 |
| Table_locks_waited                       | 2       |
+------------------------------------------+---------+
5、show engine innodb status\G;
*************************** 1. row ***************************
  Type: InnoDB
  Name:
Status:
=====================================
171221 12:09:47 INNODB MONITOR OUTPUT
=====================================
Per second averages calculated from the last 47 seconds
-----------------
BACKGROUND THREAD
-----------------
srv_master_thread loops: 339595 1_second, 339207 sleeps, 30987 10_second, 31236 background, 31233 flush
srv_master_thread log flush and writes: 343088
----------
SEMAPHORES
----------
OS WAIT ARRAY INFO: reservation count 59209, signal count 73914
Mutex spin waits 243814, rounds 785599, OS waits 12909
RW-shared spins 58108, rounds 1500837, OS waits 40638
RW-excl spins 7233, rounds 212962, OS waits 4938
Spin rounds per wait: 3.22 mutex, 25.83 RW-shared, 29.44 RW-excl
------------
TRANSACTIONS
------------
Trx id counter 3502909
MySQL 5.1之前的命令是:show innodbstatus\G;,MySQL 5.5使用上面命令即可查看innodb引擎的运行时信息。使用“\G” 可以改为纵向列出,查看更方便。
6、show variables like '%timeout%'
查看服务器配置参数
mysql> show variables like '%timeout%';
+----------------------------+----------+
| Variable_name              | Value    |
+----------------------------+----------+
| connect_timeout            | 10       |
| delayed_insert_timeout     | 300      |
| innodb_lock_wait_timeout   | 120      |
| innodb_rollback_on_timeout | OFF      |
| interactive_timeout        | 28800    |
| lock_wait_timeout          | 31536000 |
| net_read_timeout           | 30       |
| net_write_timeout          | 60       |
| slave_net_timeout          | 3600     |
| wait_timeout               | 28800    |
+----------------------------+----------+
7、SELECT * FROM information_schema.INNODB_TRX
查询 正在执行的事务:
8、SELECT * FROM INFORMATION_SCHEMA.INNODB_LOCKS;
查看正在锁的事务
9、SELECT * FROM INFORMATION_SCHEMA.INNODB_LOCK_WAITS;
查看等待锁的事务