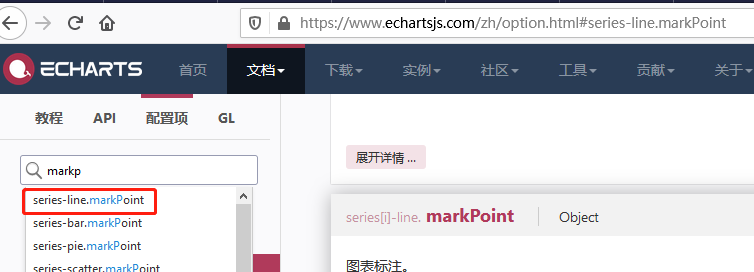
1、参考官网
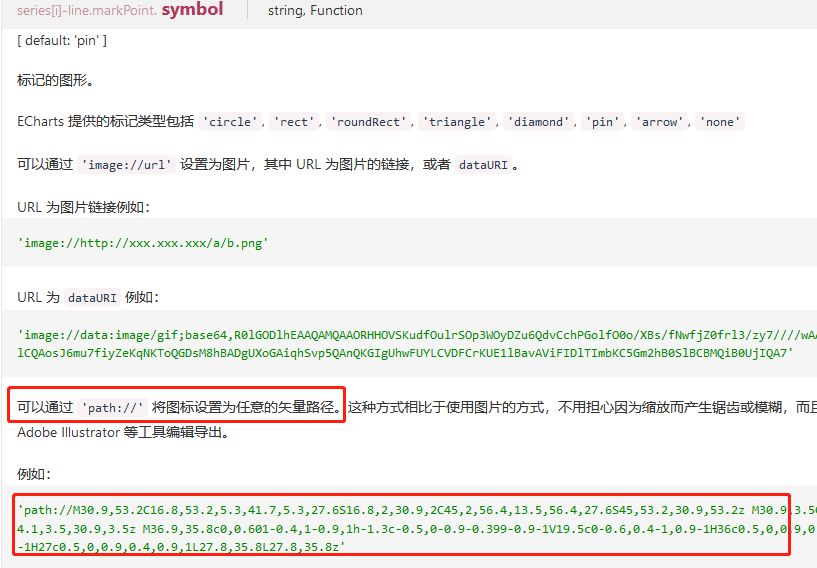
自定义markPoint的标记类型:使用图示的矢量图来定义markPoint的标记类型
2、Iconfont-阿里巴巴矢量图标库
网址:https://www.iconfont.cn/search/index, 例如搜索up找到需要的图下载
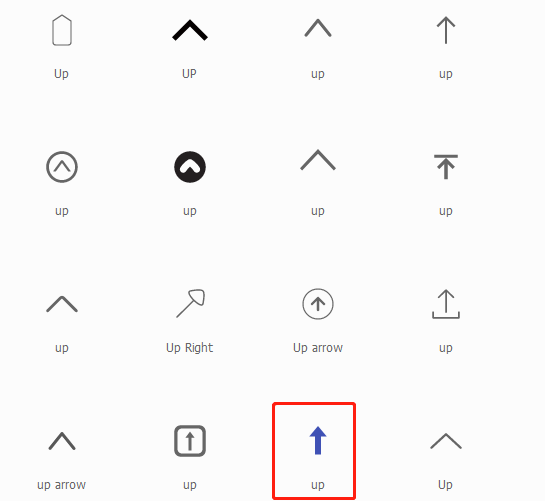
下载的结果:
<svg t="1577967477235" class="icon" viewBox="0 0 1024 1024" version="1.1" xmlns="http://www.w3.org/2000/svg" p-id="1714" width="200" height="200">
  <path d="M512 85.333333l249.6 298.666667H262.4z" fill="#3F51B5" p-id="1715"></path>
  <path d="M426.666667 320h170.666666v576h-170.666666z" fill="#3F51B5" p-id="1716"></path>
</svg>
所以矢量路径就是:M512 85.333333l249.6 298.666667H262.4z M426.666667 320h170.666666v576h-170.666666z
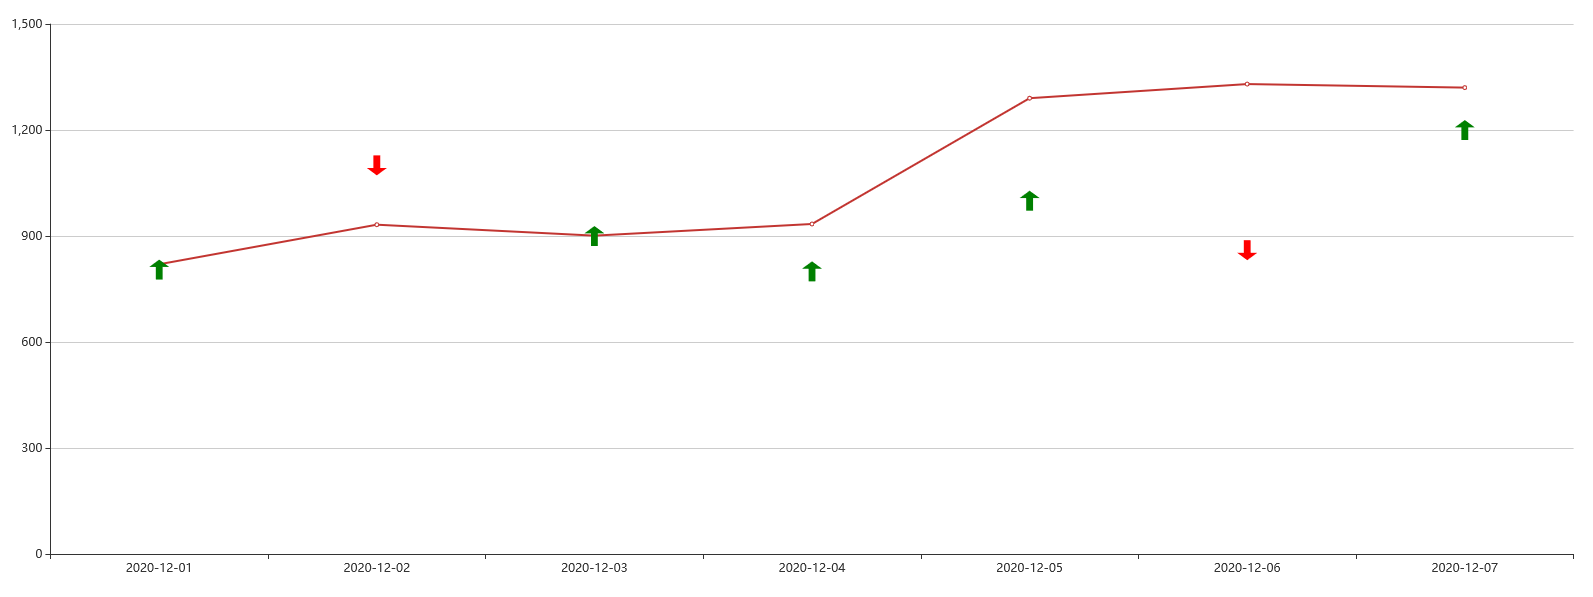
3、应用
import React from 'react'
import ReactEcharts from 'echarts-for-react'

export default class App extends React.Component {
    constructor(props) {
        super(props)
        this.state = {
            array: ['aaa', 'bbb', 'ccc']
        }
    }

    render() {
        return (
            <div>
                <ReactEcharts option={this.getOption()} theme="Imooc" style={{ height: '650px' }} />
            </div>
        )
    }

    getOption = () => {
        const data = [
            {"datetime":"2020-12-01","direction":"buy","qty":0.2,"price":805,"text":"buy 0.2 shares at 805"},
            {"datetime":"2020-12-02","direction":"sell","qty":0.2,"price":1100,"text":"buy 0.2 shares at 1100"},
            {"datetime":"2020-12-03","direction":"buy","qty":0.2,"price":900,"text":"buy 0.2 shares at 900"},
            {"datetime":"2020-12-04","direction":"buy","qty":0.2,"price":800,"text":"buy 0.2 shares at 800"},
            {"datetime":"2020-12-05","direction":"buy","qty":0.2,"price":1000,"text":"buy 0.2 shares at 1000"},
            {"datetime":"2020-12-06","direction":"sell","qty":0.2,"price":860,"text":"buy 0.2 shares at 860"},
            {"datetime":"2020-12-07","direction":"buy","qty":0.2,"price":1200,"text":"buy 0.2 shares at 1200"}
        ]
        const pointData = this.filterData(data)

        return {
            xAxis: {
                type: 'category',
                data: ['2020-12-01', '2020-12-02', '2020-12-03', '2020-12-04', '2020-12-05', '2020-12-06', '2020-12-07']
            },
            yAxis: {
                type: 'value'
            },
            series: [{
                data: [820, 932, 901, 934, 1290, 1330, 1320],
                type: 'line',
                markPoint: {
                    data: pointData,
                    tooltip: {
                        trigger: 'item',
                        position: 'top',
                        formatter: function(param) {
                            return param.name;
                        }
                    }
                }
            }]
        }
    }

    // data格式: [{"datetime":"2020-12-05","direction":"buy","qty":0.2,"price":115033,"text":"buy 0.2 shares at 115033"}, {}, ...]
    filterData = data => {
        if (!data) return []
        const newDataArray = []
        for (let unit of data) {
            let obj = {}
            if (unit['direction'] === 'buy') {
                obj.symbol = 'path://M512 85.333333l249.6 298.666667H262.4z M426.666667 320h170.666666v576h-170.666666z'
            } else if (unit['direction'] === 'sell') {
                obj.symbol = 'path://M512 938.666667L262.4 640h499.2z M426.666667 128h170.666666v576h-170.666666z'
            } else {
                obj.symbol = 'pin'
            }
            obj.symbolSize = 20
            obj.name = unit['datetime'] + '<br/>' + unit['text']
            obj.xAxis = unit['datetime']
            obj.yAxis = unit['price']
            if (unit['direction'] === 'buy') {
                obj.itemStyle = {normal: {color: 'green'}}
            } else if (unit['direction'] === 'sell') {
                obj.itemStyle = {normal: {color: 'red'}}
            } else {
                obj.itemStyle = {normal: {color: 'blue'}}
            }
            newDataArray.push(obj)
        }
        return newDataArray
    }

}
效果: