我的es数据规模为5433万,这个时候频繁执行查询、写入的操作,发现python执行有一些异常,记录下来,看看有没有解决的办法
我的脚本
from elasticsearch import Elasticsearch
from elasticsearch import helpers
body = {
            "query": {
                "range": {
                    "date": {
                        "gte": pre_time,
                        "lte": end_time
                    }
                }
            }
        }
 results = helpers.scan(
        client=es,
        query=body,
        scroll="5m",
        index=sub_index,
        doc_type='my_type',
        timeout="10m"
    )
    print('开始遍历索引')
    sources = set()
    for result in results:
1 elasticsearch.exceptions.NotFoundError: NotFoundError(404, ‘search_phase_execution_exception’, ‘No search context found for id [27563069]’)
查看Elasticsearch SearchContextMissingException during ‘scan & scroll’ query with Spring Data Elasticsearch
跟我的问题很像,也就是上下文丢失,那么什么时候上下文丢失了,也就是超时的时候。也就是说解决办法就是将timeout设置足够长。
This usually happens if your search context is not alive anymore.
查看官网资料Keeping the search context alive,可以看到scroll的时间应该足够一批数据返回就可以。
于是我将我的程序了一下,将scroll从原来的5m调整为10m,将原来的timeout10m调整为15m.然后再次执行程序观察,发现Scroll request has only succeeded on 1 shards out of 5也同步解决,也是意外的收获。
results = helpers.scan(
        client=es,
        query=body,
        scroll="10m",
        index=sub_index,
        doc_type='my_type',
        timeout="15m"
    )
The scroll parameter (passed to the search request and to every scroll request) tells Elasticsearch how long it should keep the search context alive. Its value (e.g. 1m, see Time unitsedit) does not need to be long enough to process all data — it just needs to be long enough to process the previous batch of results
Process Process-4:
Traceback (most recent call last):
  File "/usr/local/python3/lib/python3.6/multiprocessing/process.py", line 258, in _bootstrap
    self.run()
  File "/usr/local/python3/lib/python3.6/multiprocessing/process.py", line 93, in run
    self._target(*self._args, **self._kwargs)
  File "count_in_total_baidu.py", line 66, in sub_in_total
    for result in results:
  File "/usr/local/python3/lib/python3.6/site-packages/elasticsearch/helpers/__init__.py", line 379, in scan
    **scroll_kwargs)
  File "/usr/local/python3/lib/python3.6/site-packages/elasticsearch/client/utils.py", line 76, in _wrapped
    return func(*args, params=params, **kwargs)
  File "/usr/local/python3/lib/python3.6/site-packages/elasticsearch/client/__init__.py", line 1016, in scroll
    params=params, body=body)
  File "/usr/local/python3/lib/python3.6/site-packages/elasticsearch/transport.py", line 318, in perform_request
    status, headers_response, data = connection.perform_request(method, url, params, body, headers=headers, ignore=ignore, timeout=timeout)
  File "/usr/local/python3/lib/python3.6/site-packages/elasticsearch/connection/http_urllib3.py", line 186, in perform_request
    self._raise_error(response.status, raw_data)
  File "/usr/local/python3/lib/python3.6/site-packages/elasticsearch/connection/base.py", line 125, in _raise_error
    raise HTTP_EXCEPTIONS.get(status_code, TransportError)(status_code, error_message, additional_info)
elasticsearch.exceptions.NotFoundError: NotFoundError(404, 'search_phase_execution_exception', 'No search context found for id [27563069]')
2 Scroll request has only succeeded on 1 shards out of 5.
Process Process-2:
Traceback (most recent call last):
  File "/etc/python/python3.6/lib/python3.6/multiprocessing/process.py", line 258, in _bootstrap
    self.run()
  File "/etc/python/python3.6/lib/python3.6/multiprocessing/process.py", line 93, in run
    self._target(*self._args, **self._kwargs)
  File "count_in_total.py", line 67, in sub_in_total
    for result in results:
  File "/etc/python/python3.6/lib/python3.6/site-packages/elasticsearch/helpers/__init__.py", line 394, in scan
    (resp['_shards']['successful'], resp['_shards']['total'])
elasticsearch.helpers.ScanError: Scroll request has only succeeded on 1 shards out of 5.
找到了一片文章elasticsearch.helpers.ScanError: Scroll request has only succeeded on xx shards,它的原因是当index=’'为空时出现此错误,可以index,为什么会为空呢?
3 rejected execution of org.elasticsearch.transport.TransportService
Process Process-1:
Traceback (most recent call last):
  File "/usr/local/python3/lib/python3.6/multiprocessing/process.py", line 258, in _bootstrap
    self.run()
  File "/usr/local/python3/lib/python3.6/multiprocessing/process.py", line 93, in run
    self._target(*self._args, **self._kwargs)
  File "count_in_total_baidu.py", line 64, in sub_in_total
    totalEnService.sub_in_total(result.get('_source'))
  File "/usr/local/python3/lib/python3.6/site-packages/en_plugin/service/en_service.py", line 200, in sub_in_total
    self.handler(total_record)
  File "/usr/local/python3/lib/python3.6/site-packages/en_plugin/service/en_service.py", line 133, in handler
    self.opt_es(es_data)
  File "/usr/local/python3/lib/python3.6/site-packages/en_plugin/service/en_service.py", line 175, in opt_es
    success, msg = helpers.bulk(self.es, self.actions)
  File "/usr/local/python3/lib/python3.6/site-packages/elasticsearch/helpers/__init__.py", line 257, in bulk
    for ok, item in streaming_bulk(client, actions, *args, **kwargs):
  File "/usr/local/python3/lib/python3.6/site-packages/elasticsearch/helpers/__init__.py", line 192, in streaming_bulk
    raise_on_error, *args, **kwargs)
  File "/usr/local/python3/lib/python3.6/site-packages/elasticsearch/helpers/__init__.py", line 137, in _process_bulk_chunk
    raise BulkIndexError('%i document(s) failed to index.' % len(errors), errors)
elasticsearch.helpers.BulkIndexError: ('1 document(s) failed to index.', [{'index': {'_index': 'invoice_title_v3', '_type': 'invoice_title', '_id': '3ae80d12abcde7d60f72ffb7fbc4696d', 'status': 429, 'error': {'type': 'es_rejected_execution_exception', 'reason': 'rejected execution of org.elasticsearch.transport.TransportService$7@6048fcf0 on EsThreadPoolExecutor[bulk, queue capacity = 200, org.elasticsearch.common.util.concurrent.EsThreadPoolExecutor@58695c43[Running, pool size = 4, active threads = 4, queued tasks = 202, completed tasks = 13568507]]'}, 'data':
从ElasticSearch常见错误整理 5.5.x这篇文章,可以看到问题是客户端写es的速度太快了,超过es索引数据的速度。
执行GET _nodes/thread_pool可以看到index的queue_size与异常中queue capacity = 200是一致的。只不过5.x版本没看到size这个参数了。
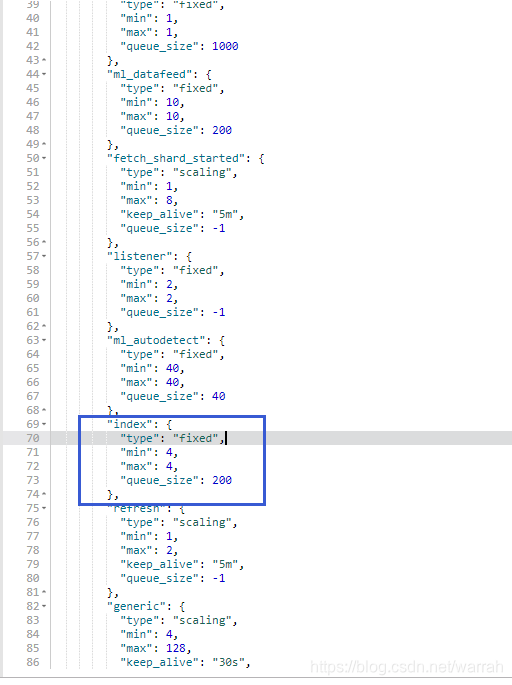
我按照sticsearch高级配置之(二)----线程池设置执行,size默认是CPU核数的5倍,我是4核CPU,所以只是稍微调大一些
PUT _cluster/settings
{
  "transient": {
    "threadpool.index.type": "fixed",
    "threadpool.index.size": 30,
    "threadpool.index.queue_size": 1000,
    "threadpool.index.reject_policy": "caller"
  }
}
提示的异常信息是
{
  "error": {
    "root_cause": [
      {
        "type": "illegal_argument_exception",
        "reason": "transient setting [threadpool.index.queue_size], not dynamically updateable"
      }
    ],
    "type": "illegal_argument_exception",
    "reason": "transient setting [threadpool.index.queue_size], not dynamically updateable"
  },
  "status": 400
}
查看Transient setting [threadpool.search.queue_size], not dynamically updateable,可以得知queue_size参数并不能通过api来更改了,需要修改配置文件并且重启机器。
我在中elasticsearch.yml中添加这些配置,但是也会下面的错误,有点崩溃
threadpool.index.type: fixed
threadpool.index.size: 40
threadpool.index.queue_size: 1000
threadpool.index.reject_policy: caller
Suppressed: java.lang.IllegalArgumentException: unknown setting [threadpool.index.size] did you mean any of [thread_pool.index.size, thread_pool.get.size, thread_pool.index.queue_size, thread_pool.listener.size, thread_pool.bulk.size]?
找不到解决办法,只能寻求官方文档Thread Pool
4 Caused by: org.elasticsearch.client.transport.NoNodeAvailableException
初步设想es既然是集群模式,那么及时一个节点停掉,应该也不会影响使用,于是我就在生产环境听了一个,结果造成生产环境业务大面积瘫痪,真是惨痛的教训。为什么es集群容错这么低呢?最让人优先想到的是,通过haproxy做代理。
data:
    elasticsearch:
      cluster-name: xx_product
      cluster-nodes: 192.168.1.1:9300,192.168.1.2:9300,192.168.1.3:9300
      local: false
      repositories:
        enabled: true
Caused by: org.elasticsearch.client.transport.NoNodeAvailableException: None of the configured nodes are available: [{#transport#-1}{a8wHYOwIRjC2sQYilPldrg}{172.19.123.151}{172.19.123.151:9300}, {#transport#-2}{4stEpD9KQSesdbmn2Hldxw}{172.19.123.150}{172.19.123.150:9300}]
	at org.elasticsearch.client.transport.TransportClientNodesService.ensureNodesAreAvailable(TransportClientNodesService.java:347)
	at org.elasticsearch.client.transport.TransportClientNodesService.execute(TransportClientNodesService.java:245)
	at org.elasticsearch.client.transport.TransportProxyClient.execute(TransportProxyClient.java:59)
	at org.elasticsearch.client.transport.TransportClient.doExecute(TransportClient.java:363)
	at org.elasticsearch.client.support.AbstractClient.execute(AbstractClient.java:408)
	at org.elasticsearch.action.ActionRequestBuilder.execute(ActionRequestBuilder.java:80)
	at org.elasticsearch.action.ActionRequestBuilder.execute(ActionRequestBuilder.java:54)
	at org.elasticsearch.action.ActionRequestBuilder.get(ActionRequestBuilder.java:62)
	at com.bwjf.rss.service.impl.CustomerServiceImpl.add(CustomerServiceImpl.java:98)
	at com.bwjf.rss.kfk.KfkConsumer.processCustomerMessage(KfkConsumer.java:50)
	at sun.reflect.GeneratedMethodAccessor62.invoke(Unknown Source)
	at sun.reflect.DelegatingMethodAccessorImpl.invoke(DelegatingMethodAccessorImpl.java:43)
	at java.lang.reflect.Method.invoke(Method.java:498)
	at org.springframework.messaging.handler.invocation.InvocableHandlerMethod.doInvoke(InvocableHandlerMethod.java:180)
	at org.springframework.messaging.handler.invocation.InvocableHandlerMethod.invoke(InvocableHandlerMethod.java:112)
	at org.springframework.kafka.listener.adapter.HandlerAdapter.invoke(HandlerAdapter.java:48)
	at org.springframework.kafka.listener.adapter.MessagingMessageListenerAdapter.invokeHandler(MessagingMessageListenerAdapter.java:174)
	... 8 common frames omitted
3.1 index/delete
也就是说,index/delete操作,线程池的大小取决于可用进程数有关系,max值为1+可用进程数,这么说来es的服务实际上对cpu的核数是有要求的,CPU核数越高,俺么index的速度就会越快。
For index/delete operations. Thread pool type is fixed with a size of # of available processors, queue_size of 200. The maximum size for this pool is 1 + # of available processors.
虽然cpu的使用并不高,但是对核数还是有要求的
3.2 search
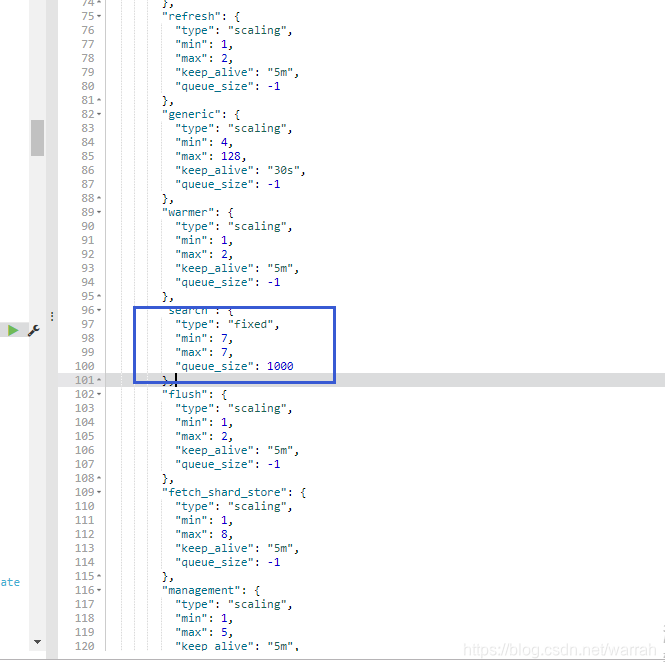
For count/search/suggest operations. Thread pool type is fixed with a size of int((# of available_processors * 3) / 2) + 1, queue_size of 1000.
3.3 bulk
脚本success, msg = helpers.bulk(self.es, self.actions)应该用到的是这个,它的默认值与index一样
文章中并没有找到动态修改的办法
设置bulk.size:40,我的cpu核数是8按道理没有问题,但是在实际启动始终却是必须小于9,真的很奇怪
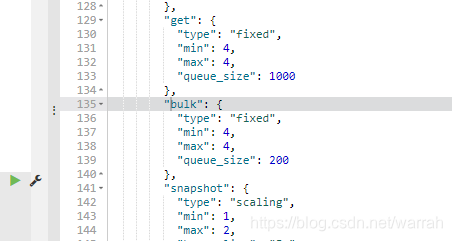
更改elasticsearch.yml中添加配置thread_pool.bulk.queue_size: 2000
更改后,依次按照原
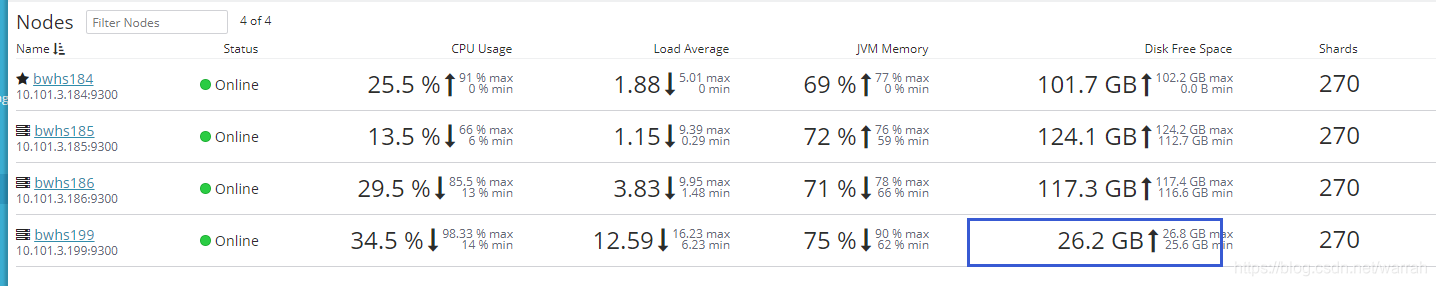
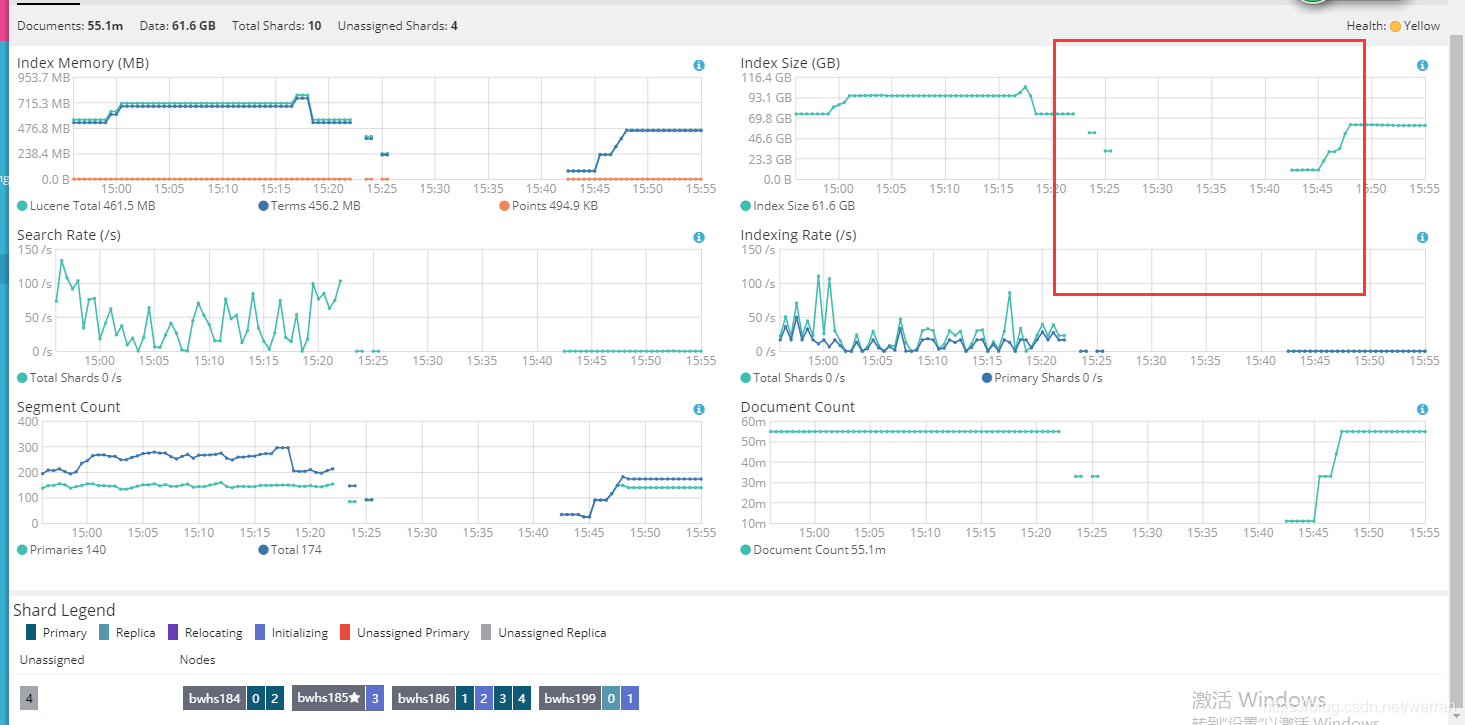
第1.8章 elasticsearch水平扩展重启节点
索引状态变为red,过了一会儿编程了yellow,要是丢了数据,按我就崩溃了。
从下面的监控来看,应该是还在调整中。
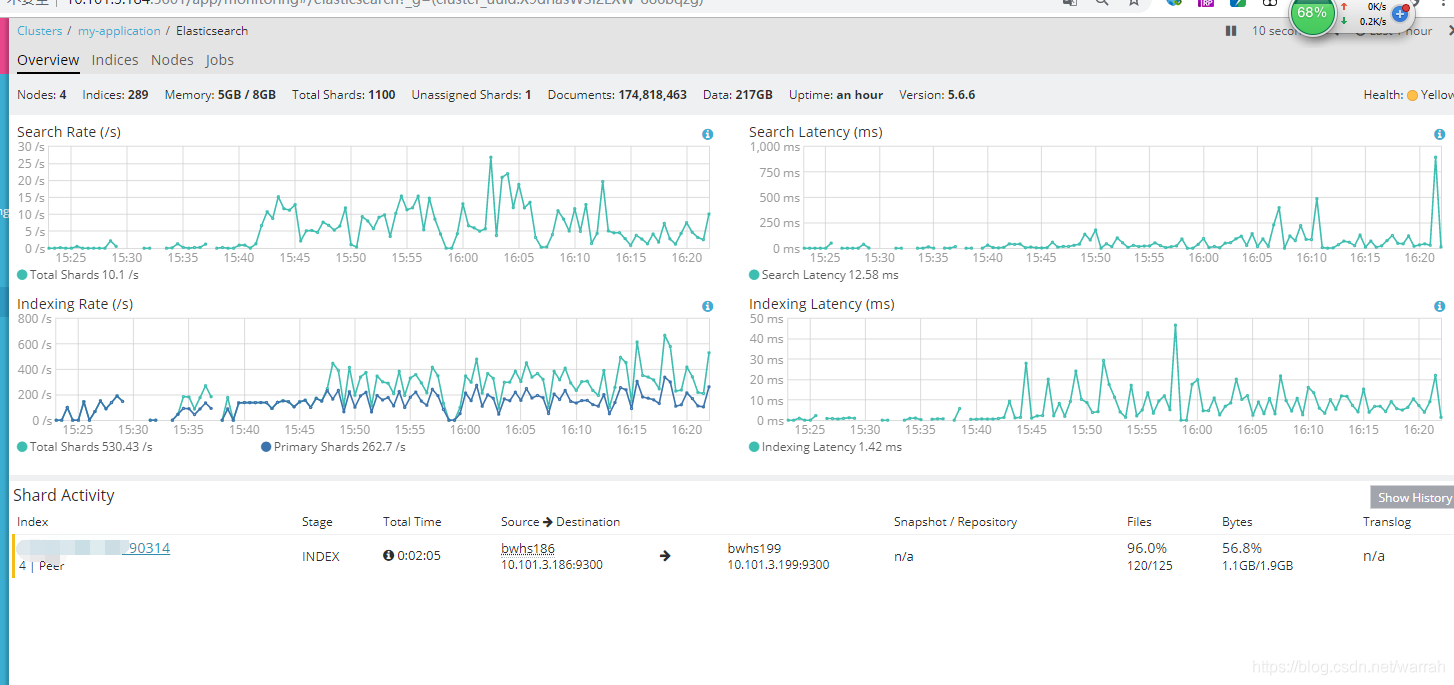
这里可以看到迁移的进度
执行命令GET _cat/thread_pool,下图数字的顺序是active, queue and rejected
队列中的数据很容易就到200了,所以设置大一点,应该有效果。
你还可以执行GET _cat/thread_pool/bulk?v&h=id,name,active,rejected,completed,专门查看bulk的情况
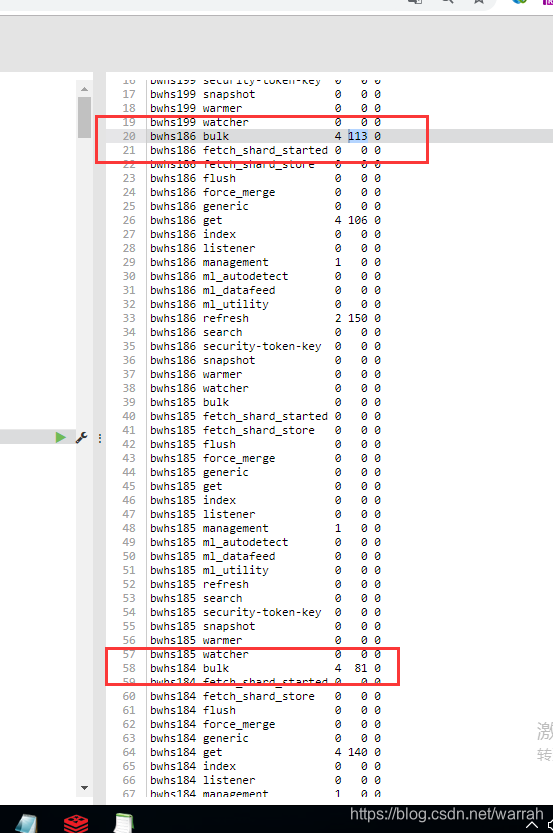
跟踪日志,没有发现bulk异常了,问题解决