相关安装包的下载
链接:https://pan.baidu.com/s/1ejM0V0f7H1Ikic_vpYGr_w
提取码:axeq
安装步骤
1、将安装包放到部署机器上
2、解压包 tar -zxvf prometheus-2.6.1.linux-amd64.tar.gz
3、移动并重命名到安装目录下 mv prometheus-2.6.1.linux-amd64.tar.gz /usr/local/prometheus
4、进入目录下并修改配置文件prometheus.yml 添加监控机器
# my global config
global:
  scrape_interval:     15s # 默认没15s拉取一次数据点数据
  evaluation_interval: 15s # Evaluate rules every 15 seconds. The default is every 1 minute.
  # scrape_timeout is set to the global default (10s).

# Alertmanager configuration
alerting:
  alertmanagers:
  - static_configs:
    - targets:
      # - alertmanager:9093

# Load rules once and periodically evaluate them according to the global 'evaluation_interval'.
rule_files:
  # - "first_rules.yml"
  # - "second_rules.yml"

# A scrape configuration containing exactly one endpoint to scrape:
# Here it's Prometheus itself
scrape_configs:
  # The job name is added as a label `job=<job_name>` to any timeseries scraped from this config.
  - job_name: 'prometheus'   static_configs:
    - targets: ['localhost:9090']  #监控本地及端口默认9090

  - job_name: 'node_exporter_local'  #通过node_exporter收集的数据 下面会有介绍
    scrape_interval: 5s
    static_configs:
    - targets: ['192.168.2.35:9100']
5、启动
./prometheus --config.file=prometheus.yml
注:第一次操作可能启动报错百分之99是yml文件 修改的问题


# 指定配置文件
--config.file="prometheus.yml"
# 指定监听地址端口
--web.listen-address="0.0.0.0:9090"
# 最大连接数
--web.max-connections=512
# tsdb数据存储的目录,默认当前data/
--storage.tsdb.path="data/"
# premetheus 存储数据的时间,默认保存15天
--storage.tsdb.retention=15d
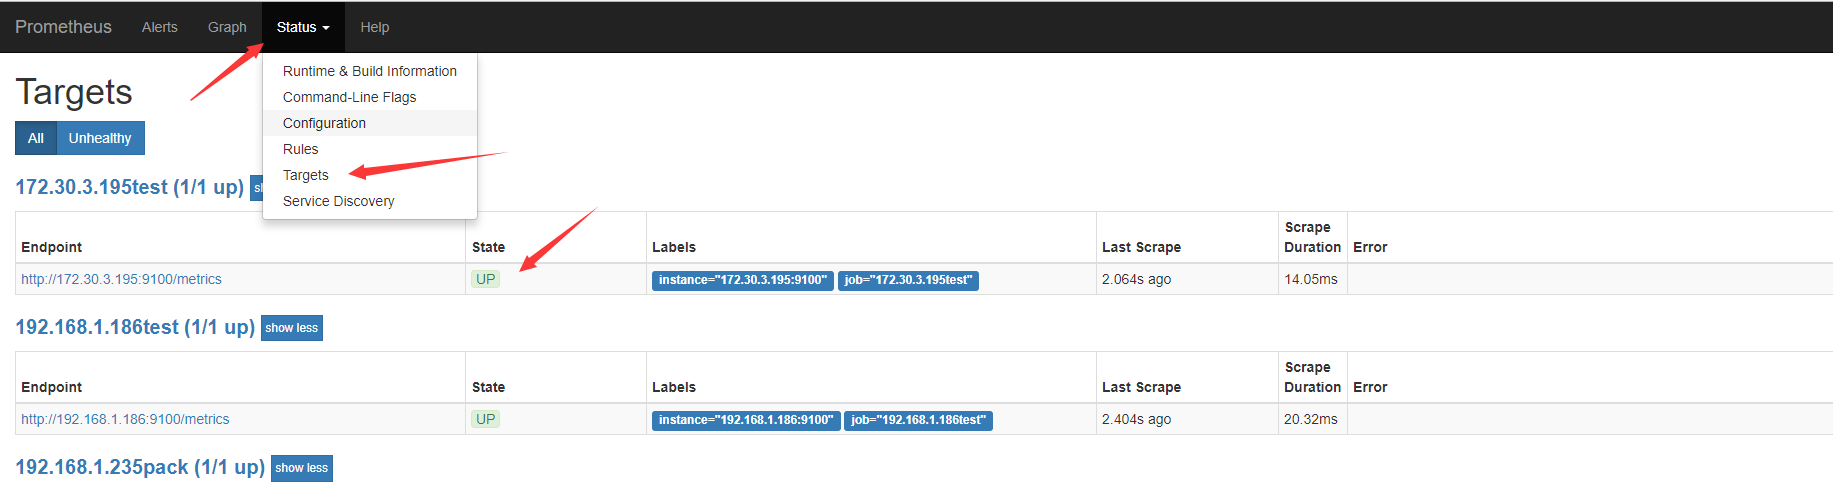
6、网页访问:http://localhost:9090
查看监控机器 up表示正常
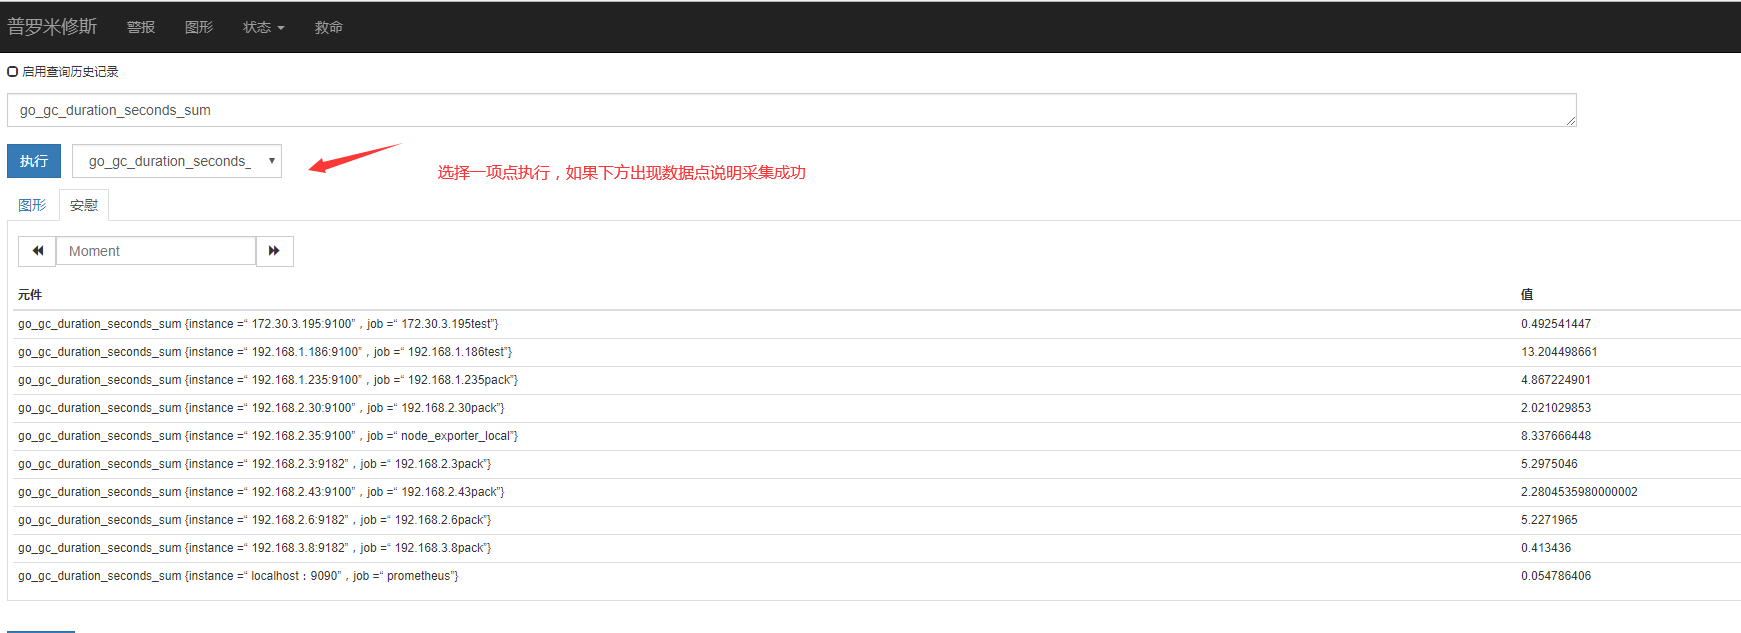
查看数据采集情况
7、为了启动和重启方便 将prometheus 配置成服务

cd /usr/lib/systemd/system
vim prometheus.service
[Unit]
  Description=https://prometheus.io

  [Service]
  Restart=on-failure
  ExecStart=/usr/local/prometheus/prometheus --config.file=/usr/local/prometheus/prometheus.yml

  [Install]
  WantedBy=multi-user.target
systemctl daemon-reload

8、启动重启

systemctl stop promethus.service
systemctl restart promethus.service


安装 node-exporter 或 wmi_exporter-0.9.0-amd64

node-exporter 监控linux相关的系统下使用 默认端口9100
链接:https://pan.baidu.com/s/1CL5n05rnwAV8h1ArNJ2ofw
提取码:410r
将node-exporter 放到/usr/bin 下 执行 nohup /usr/bin/exporter &
wmi_exporter-0.9.0-amd64 监控windows机器的使用 默认端口9082
链接:https://pan.baidu.com/s/1-7l6GUQ5-HNrJKR0mchVYA
提取码:gou6
随便目录下 双机执行即可
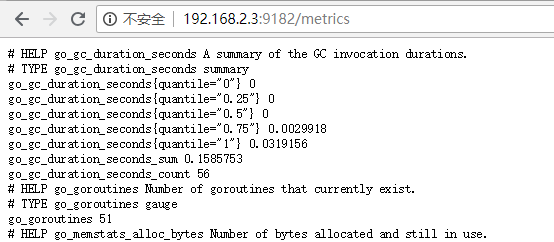
测试
http://监控机器ip:端口