demo
https://antv.alipay.com/zh-cn/f2/3.x/demo/index.html
可交互的折线图和柱形图,注意,pc端无法触发点击事件。。。
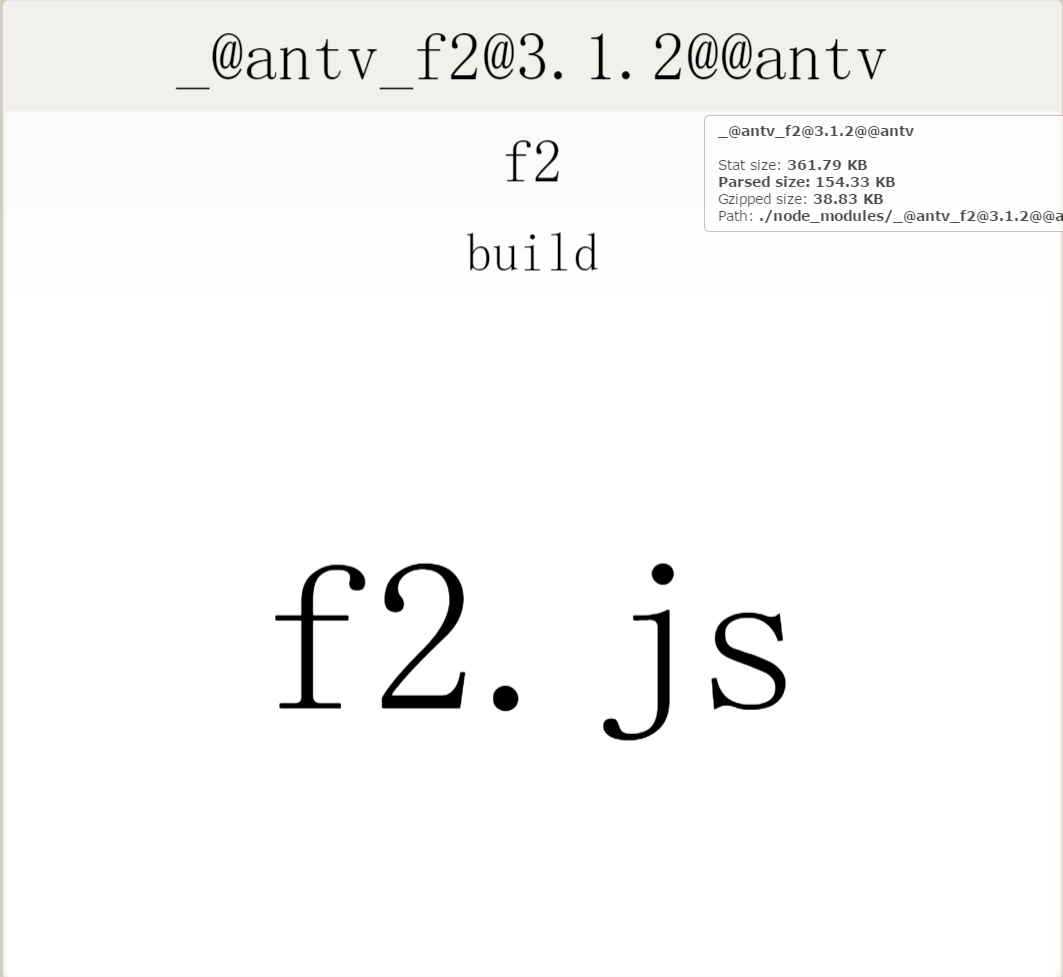
全部引入后大小压缩后38k。。。比起echart简直是轻量太多了
const F2 = require('@antv/f2');
也可以按需引入
const F2 = require('@antv/f2/lib/index-common')
| 版本 | 描述 | 大小(压缩之后) |
|---|---|---|
require('@antv/f2/lib/core') |
不包含任何图形,只有图形语法的核心代码 | 82K |
require('@antv/f2/lib/index-simple') |
仅包含简单的折线图、柱状图(包含分组柱状图、层叠柱状图、瀑布图)、饼图(包含环图) | 93 k |
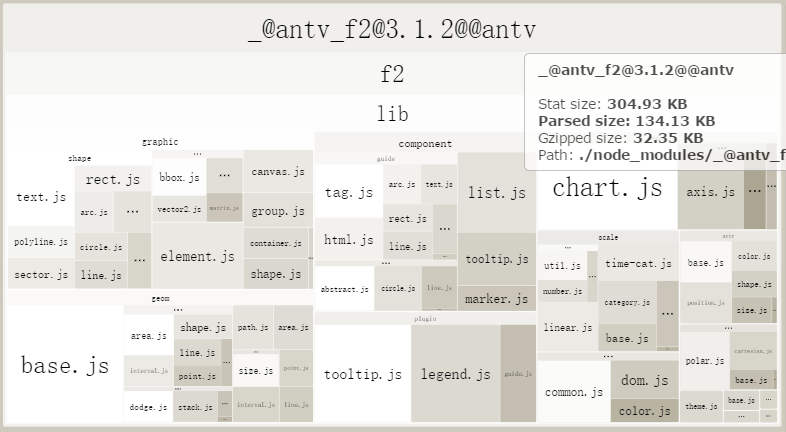
require('@antv/f2/lib/index-common') |
包含常用的图表类型: 面积图(包含层叠面积图)、柱状图(包含分组柱状图、层叠柱状图、瀑布图)、折线图、点图(包含气泡图)、饼图(包含环图)、雷达图等;坐标系包含:直角坐标系、极坐标系支持;timeCat 类型度量;图表组件(tooltip、legend 以及 guide) | 139K |
require('@antv/f2') |
完整版 | 155K |
感觉基本上可以全部引入。就算按需引入其实也就能小几k而已。。。
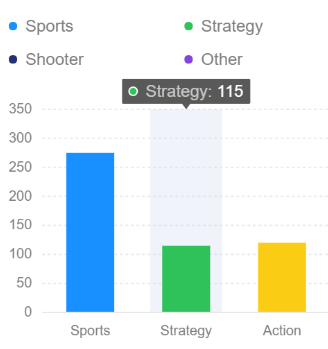
柱状图
<template>
  <canvas id="myChart" width="400" height="260"></canvas>

</template>

<script>
  const F2 = require('@antv/f2');
  export default {
    name: "g1",
    mounted() {
      // F2 对数据源格式的要求,仅仅是 JSON 数组,数组的每个元素是一个标准 JSON 对象。
      const data = [
        {genre: 'Sports', sold: 275},
        {genre: 'Strategy', sold: 115},
        {genre: 'Action', sold: 120},
        {genre: 'Shooter', sold: 350},
        {genre: 'Other', sold: 150},
      ];

      // Step 1: 创建 Chart 对象
      const chart = new F2.Chart({
        id: 'myChart',
        pixelRatio: window.devicePixelRatio // 指定分辨率
      });

      // Step 2: 载入数据源
      chart.source(data);

      // Step 3:创建图形语法,绘制柱状图,由 genre 和 sold 两个属性决定图形位置,genre 映射至 x 轴,sold 映射至 y 轴
      chart.interval().position('genre*sold').color('genre');

      // Step 4: 渲染图表
      chart.render();
    }
  }
</script>

<style scoped>

</style>
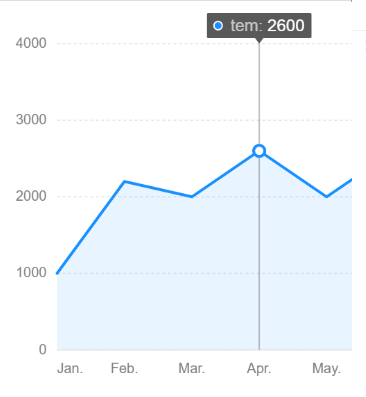
折线图
<template>
  <div class="chart-wrapper" >
    <canvas id="mountNode"></canvas>
  </div>
</template>

<script>
  const F2 = require('@antv/f2');
  export default {
    name: "g2",
    mounted() {
      const data = [
        {time: 'Jan.', tem: 1000},
        {time: 'Feb.', tem: 2200},
        {time: 'Mar.', tem: 2000},
        {time: 'Apr.', tem: 2600},
        {time: 'May.', tem: 2000},
        {time: 'Jun.', tem: 2600},
        {time: 'Jul.', tem: 2800},
        {time: 'Aug.', tem: 2000}
      ];
      const chart = new F2.Chart({
        id: 'mountNode',
        width: window.innerWidth,
        height: window.innerWidth > window.innerHeight ? (window.innerHeight - 54) : window.innerWidth * 0.707,
        pixelRatio: window.devicePixelRatio
      });

      chart.source(data);
      chart.tooltip({
        showCrosshairs: true
      });
      chart.scale({
        time: {
          range: [0, 1]
        },
        tem: {
          tickCount: 5,
          min: 0
        }
      });
      chart.axis('time', {
        label(text, index, total) {
          const textCfg = {};
          if (index === 0) {
            textCfg.textAlign = 'left';
          }
          if (index === total - 1) {
            textCfg.textAlign = 'right';
          }
          return textCfg;
        }
      });
      chart.area().position('time*tem');
      chart.line().position('time*tem');
      chart.render();
    }
  }
</script>