本文为奥地利维也纳模都尔大学(作者:Selin üzelgecici)的学士论文,共60页。
如今,消费电子市场蓬勃发展,销售额年增长率接近15%(2016年,未来市场观察FMI)。然而,它的竞争非常激烈。在这个市场上,苹果、微软、东芝、惠普是最知名的股份公司,它们在市场上进行着具有竞争力的交易。许多投资者每天都在监控这些股票及其竞争对手。对这些股票进行分析和预测,可以为投资者和研究者提供一些有关这些股票的历史、当前和未来市场价值的想法,为消费电子市场和发展方向提供参考。因此,本论文的选题是合理的。
本文主要采用时间序列分析方法对股票进行分析。采用eViews进行时间序列分析,主要是定量的分析。此外,所有使用的方法都将在论文中进行说明。研究方法论是非常基础的知识,在文献回顾中,将解释所有的方法和必要的术语。因此,这项研究可以被任何一个没有金融知识的人理解。例如,拥有资本但缺乏财务信息的潜在投资者。本文可以被看作是创业投资者的手册,这也是本文的另一个目的。这项研究将回答消费电子产品市场是否具有增长趋势,以及这是否可以用时间序列数据来解释。如前所述,将解释如何使用时间序列分析和评估波动性的主要财务术语和主题,实例采用了雅虎金融的股票数据。相关计算主要通过Microsoft Excel完成。
Nowadays the consumer electronics markethas been booming with nearly 15% yearly growth rate of sales (FMI (Futuremarket insights), 2016). It is extremely competitive. In this market, AppleCorporation, Microsoft Corporation, Toshiba Corporation, HP Inc. are the mostwell-known stocks, which are traded competitively on the market. Many investorsare monitoring these stocks and their competitors daily. Analyzing andforecasting of these stocks could give some ideas about historic, current, andfuture market value of those stocks to investors and to researchers for theconsumer electronics markets and the market’s direction. Therefore, it wasconsidered a reasonable topic for this bachelor thesis. The thesis will focuson analyzing the stocks with the time series analysis methods. It is planned tobe mostly quantitative by using eViews for time series analysis. Additionally,all the methods used will be explained in the methodology part. The methodologygoes very basic and in literature review all the methods and necessary termsand jargon will be explained. Therefore, this study could be understood by anyindividual with no finance knowledge. For instance, a potential investor withcapital but lacking financial information. Therefore, this thesis can be seenas a handbook for a starting investor, which would be another purpose of thisthesis. The study will answer if there is an increasing trend on the consumer electronicsmarket and if this could be explained by time series data. As mentioned, mainfinancial terms and topics to understand how to use time series analysis andassessing volatility will be explained. Stock data from Yahoo Finance will beused. The calculations will mainly be done through Microsoft Excel.
1 引言
2 商业描述
3 文献回顾
4 研究方法
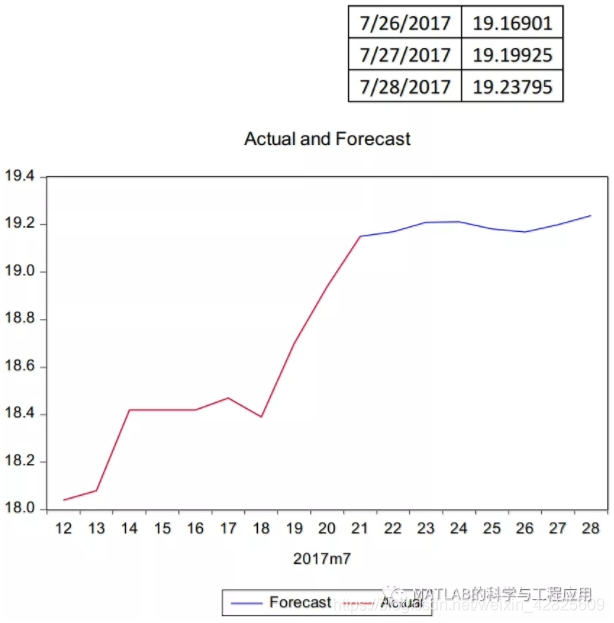
5 预测与结果
6 结论
7 局限与建议
8 参考文献
更多精彩文章请关注公众号: