1、监控MySQL(mysqld-exporter)
https://github.com/prometheus/mysqld_exporter/releases/download/v0.11.0/mysqld_exporter-0.11.0.linux-amd64.tar.gz
(1)被监控mysql机器安装mysqld-exporter
#tar -C /usr/local/ -xvf mysqld_exporter-0.11.0.linux-amd64.tar.gz
(2)设置配置文件,user为数据库登录用户,password为这个用户的密码
vi .my.cnf
[client]
user=root
password=123456
(3)启动mysqld-exporter
/usr/local/mysqld_exporter-0.11.0.linux-amd64/mysqld_exporter --config.my-cnf="/usr/local/mysqld_exporter-0.11.0.linux-amd64/.my.cnf" &
(4)prometheus配置文件中加入mysql监控并重启
vim /usr/local/Prometheus/prometheus.yml
默认mysqld-exporter端口为9104
- job_name: 'MySQL'
static_configs:
- targets: ['192.168.0.103:9104']
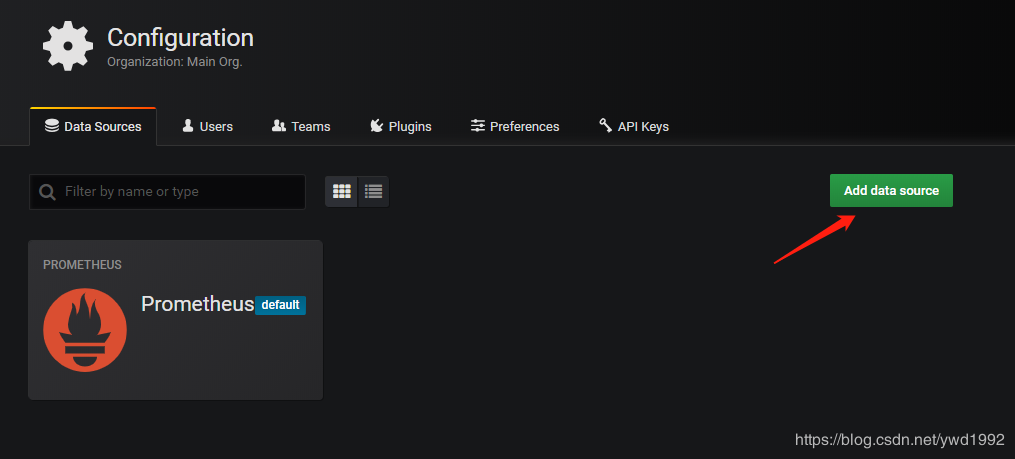
(5)设置数据源
grafana界面添加mysql数据源


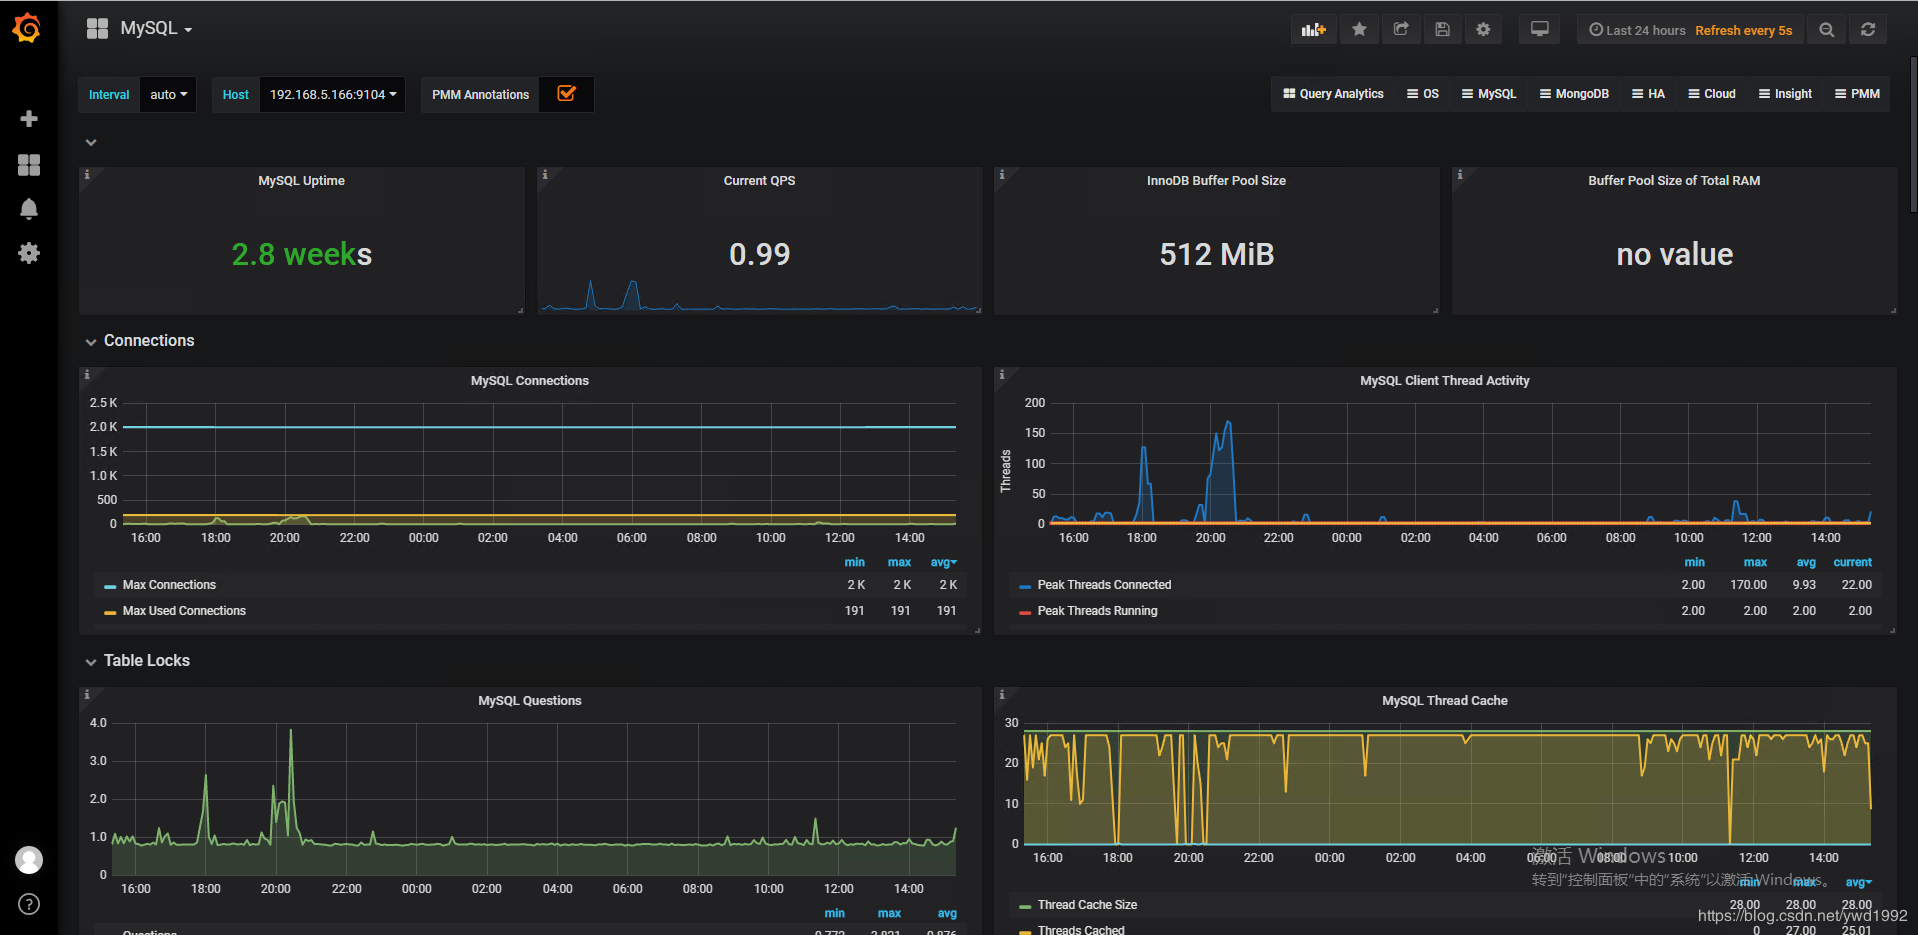
(6)导入已经画好的dashboard,数据源选择刚刚创建好的mysql数据源即可
- 链接:https://pan.baidu.com/s/1GBzogDLsYS3IvwH4WbdPLw 提取码:ef6e
2、监控Redis(redis_exporter)
链接:https://pan.baidu.com/s/12y7HxtQlBjFwr_i8ClM8Kw 提取码:13v2
(1)安装redis_exportertar -C /usr/local/ -xvf redis_exporter-v0.15.0.linux-amd64.tar.gz
(2)启动redis_exporter默认redis_exporter端口为9121
./redis_exporter redis//192.168.0.103:6379 & -web.listenaddress 192.168.0.103:9121
(3)prometheus配置文件中加入redis监控并重启vim /usr/local/Prometheus/prometheus.yml
默认redis-exporter端口为9121- job_name: 'Redis'
static_configs:
- targets: ['192.168.0.103:9121']
(4)grafana导入画好的dashboard链接:https://pan.baidu.com/s/1LIkVC0o3lyTT59JbX0mSpg 提取码:gf1d
